

Hello there! 😀
And a Merry BES-mas to all British politics nerds: the new British Election Study Internet Panel data has just been released.
This is one of the best sources we have for tracking public opinion in the UK. It follows people over time, asking them about their demographics, vote choices and political attitudes. It is especially powerful for looking not just at what the electorate thinks at any one moment, but also how and when people change their minds. Since the 2024 election, a lot has happened (to put it lightly) so there are dozens of possible stories in this data.
For now, I’m going to focus on what has happened to people who voted Labour in 2024.
How many are still with the party?
More to the point, how many have left?
Most importantly, why might that be?
It’s worth stressing that this survey was carried out in May, so things may have already moved on. All conclusions here are tentative and come with the usual caveats etc. etc. With that out of the way, though, let’s dive in.
Where Did 2024 Labour Voters Go?
First up, how many voters from 2024 are still backing the party? The answer is not great for Labour.
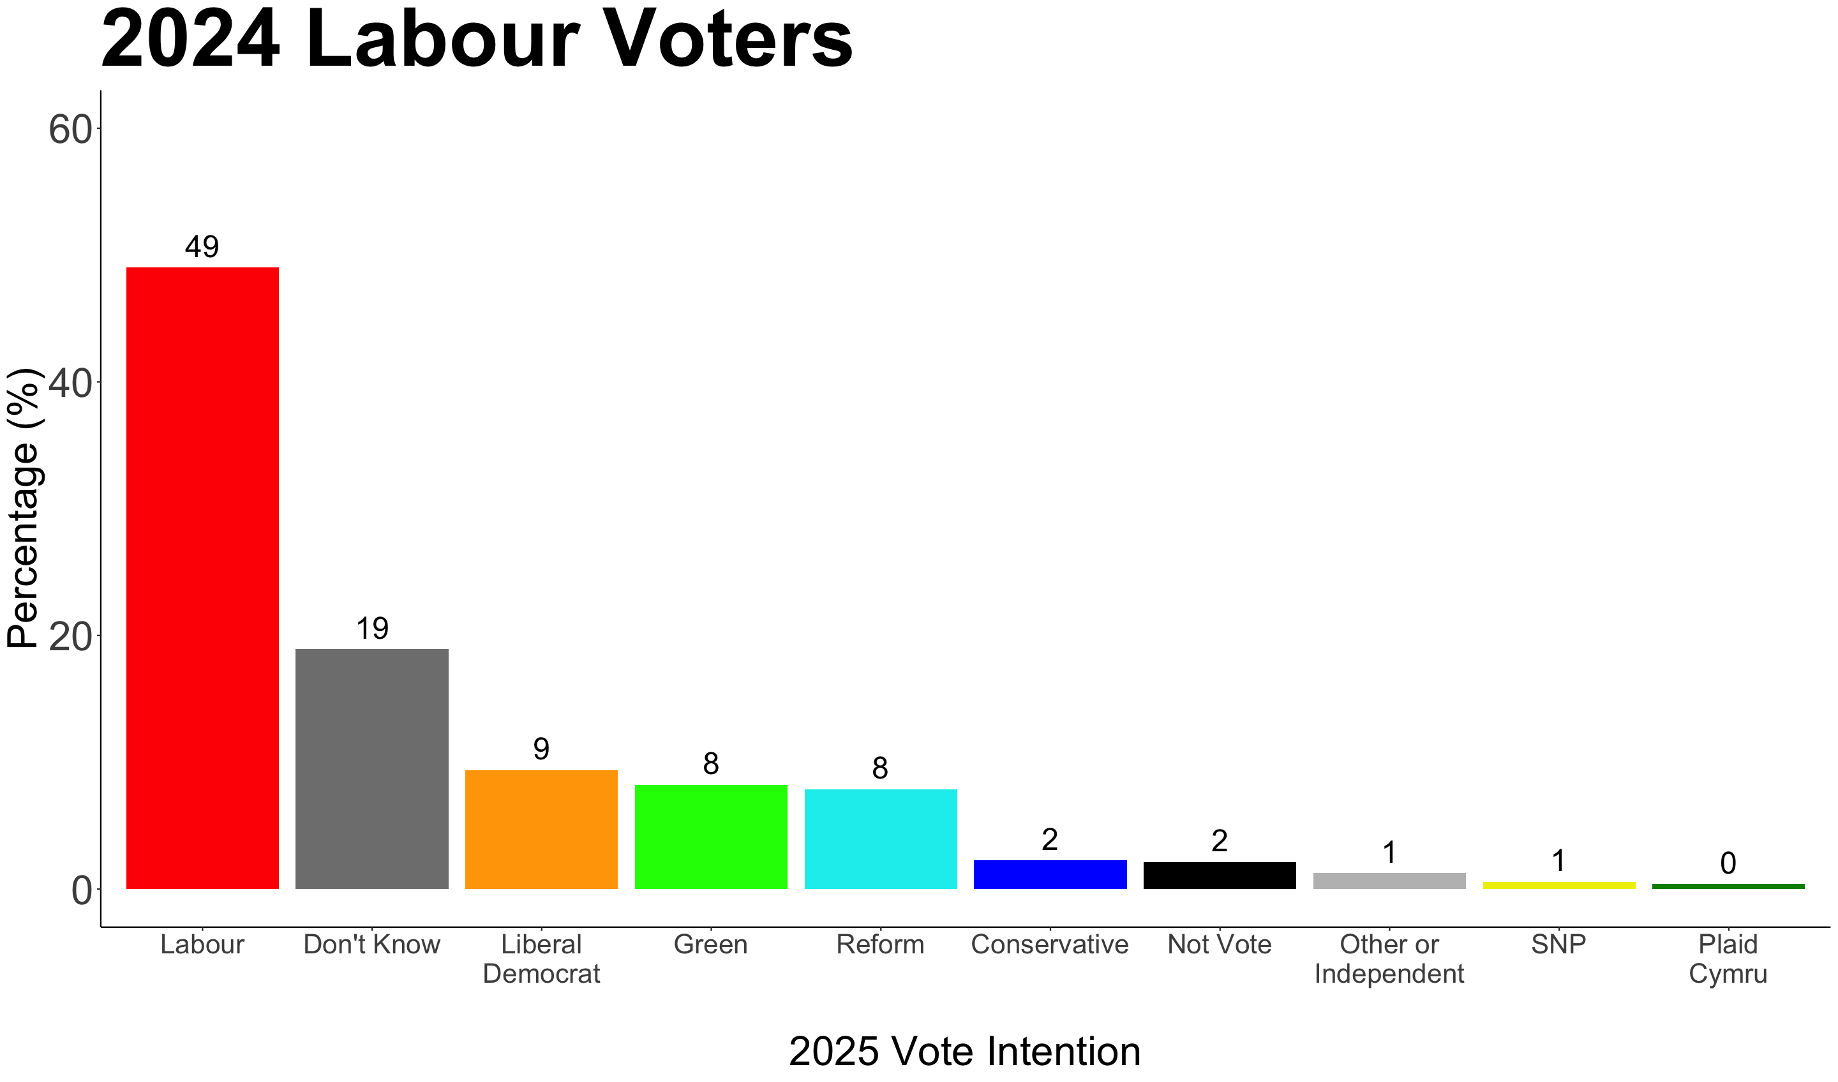
Only 49% of those who voted Labour in 2024 say they would still do so. Given that Labour’s victory was built on a small popular vote share and relatively narrow leads in a lot of constituencies, this is troubling. The UK’s First-Past-The-Post (FPTP) rewards efficiency, but the margin between victory and defeat is razor-thin at the moment with so much fragmentation. Even a small swing can translate into the loss of dozens of seats.
A further 19% now say they don’t know who they would vote for. In theory, that could be an opportunity if Labour can win them back, but it doesn’t exactly inspire confidence that this number is so high after just a year.
Among those who have switched, the losses are mostly to other progressive parties. 9% say they would now vote Liberal Democrat and 8% say Green. However, another 8% say Reform, which is a very different proposition for Labour to try to win back.
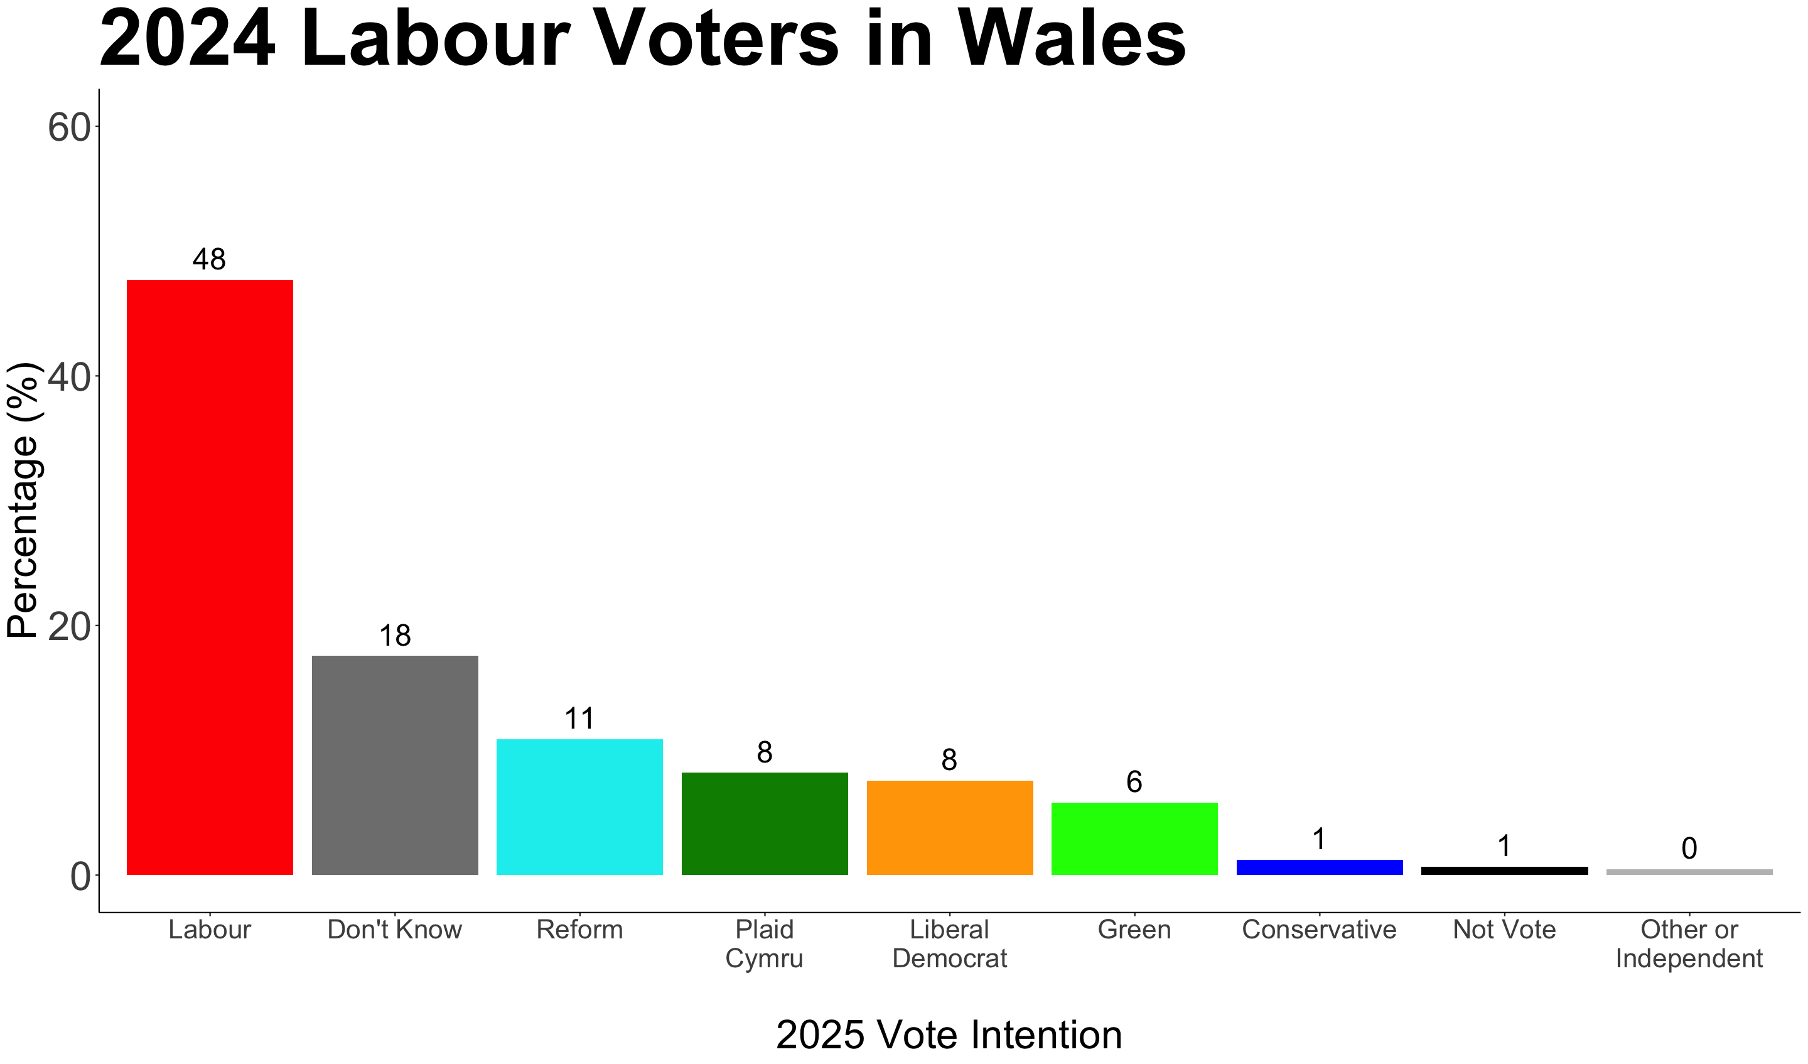
Isolating this to just Wales, the pattern looks broadly similar to the UK-wide picture. 48% would stick with Labour and 18% are now unsure. Reform does a bit better in Wales with 11% but there are also significant losses to Plaid (8%), Liberal Democrats (8%) and Greens (6%).
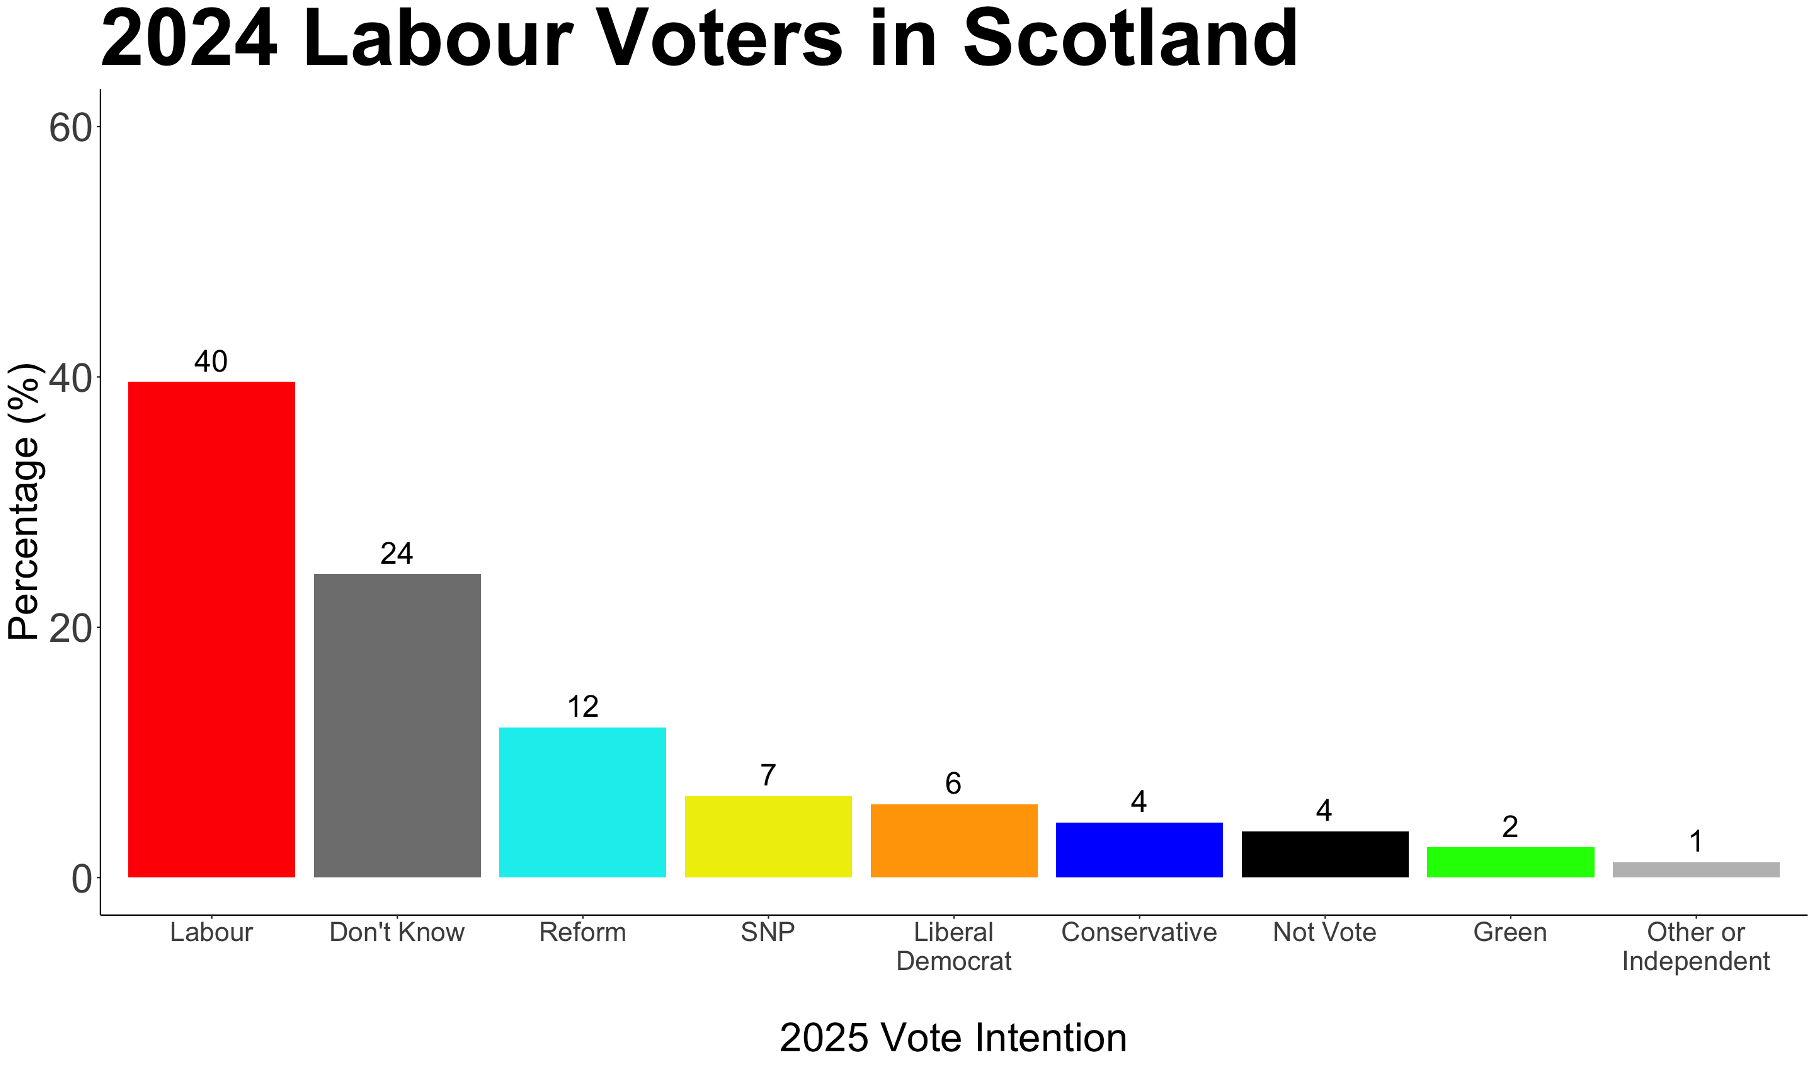
Scotland looks worse for Labour. Only 40% of 2024 voters there say they would stick with the party. Here, 24% say they don’t know. Reform is on 12% and the Conservatives 4%. Together that is about the same as the SNP (7%), Liberal Democrats (6%) and Greens (2%) combined.
Who are ya?
Here are the demographics of people who left Labour, compared to those who stayed.
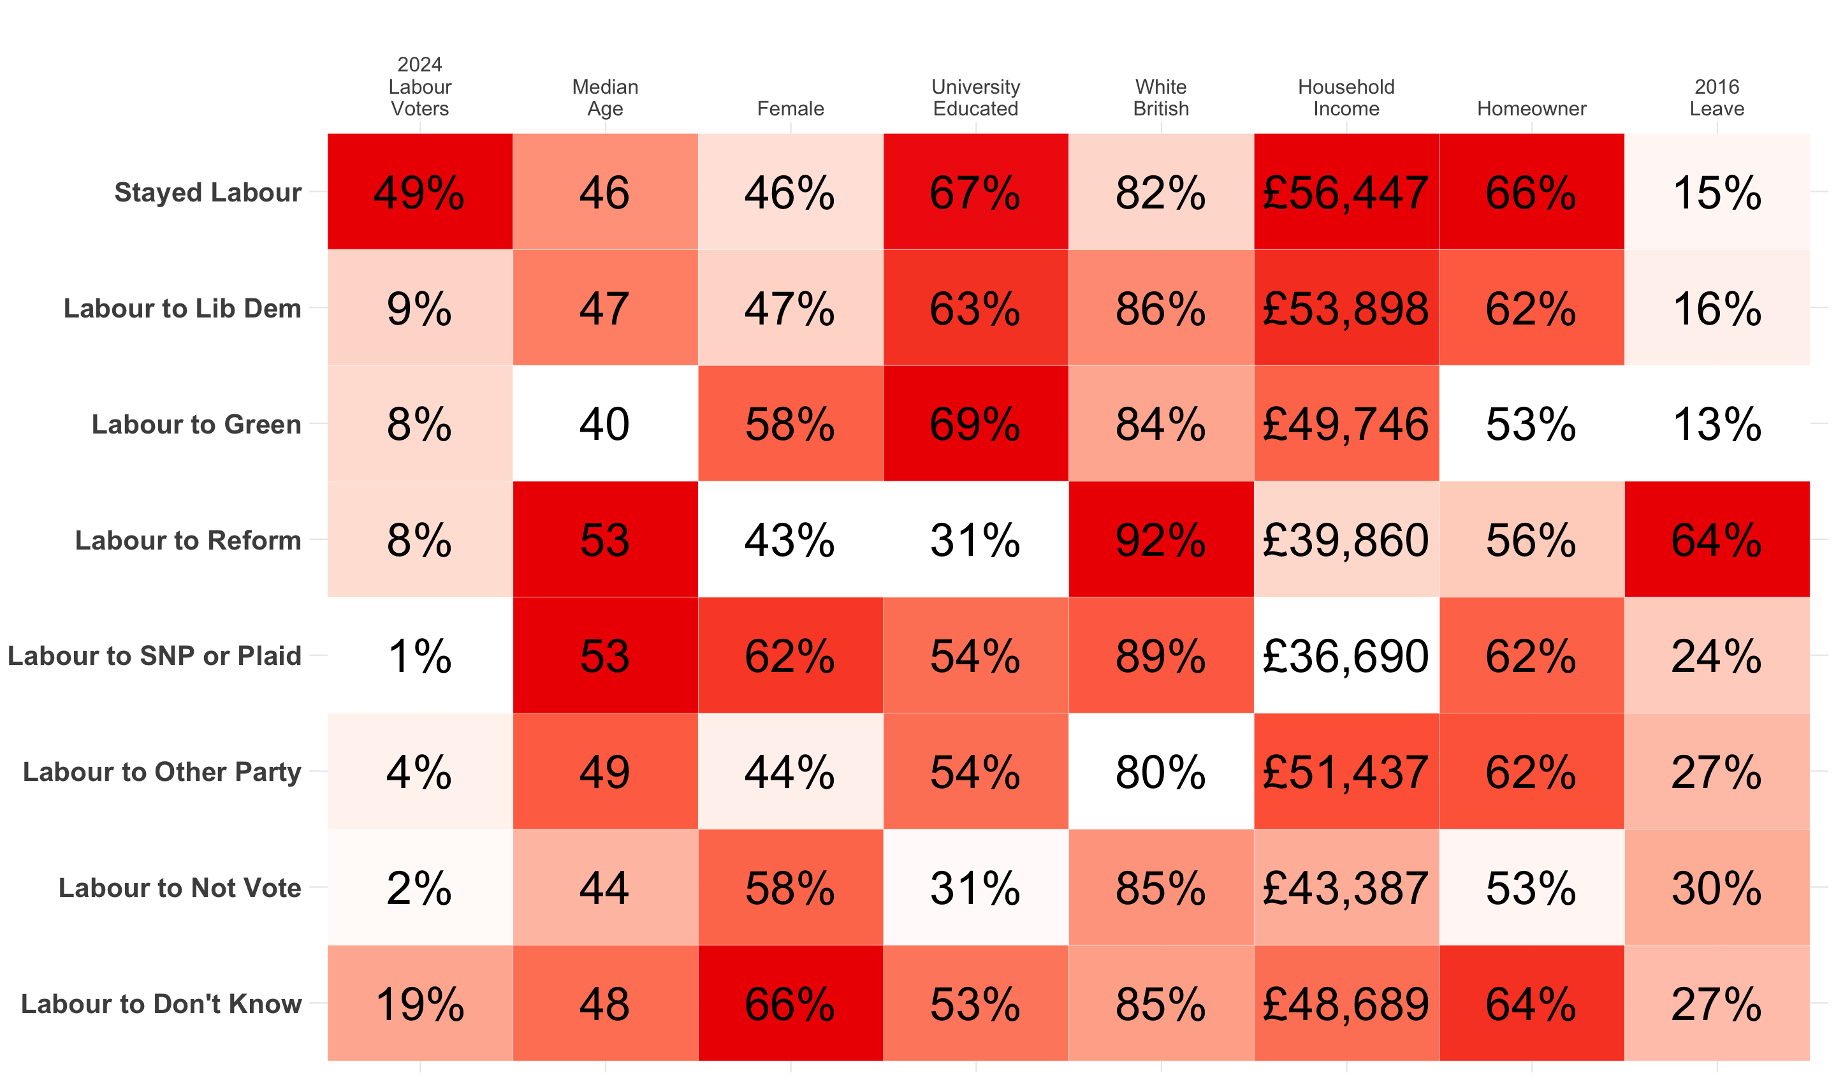
The youngest group are those who switched to the Greens, with an average age of 40. The oldest are those who switched to Reform or to the SNP/Plaid, both at 53. Women make up two thirds of those who moved to don’t know, whereas men make up 57% of those who switched to Reform. Among Green switchers, 69% have a university degree, but among Reform switchers, only 31% do. People who stayed with Labour or moved to the Liberal Democrats tend to have the highest incomes, but those who moved to the SNP or Plaid have the lowest. Every group here strongly backed Remain in 2016, except for the Reform switchers, where 64% of backed Leave.
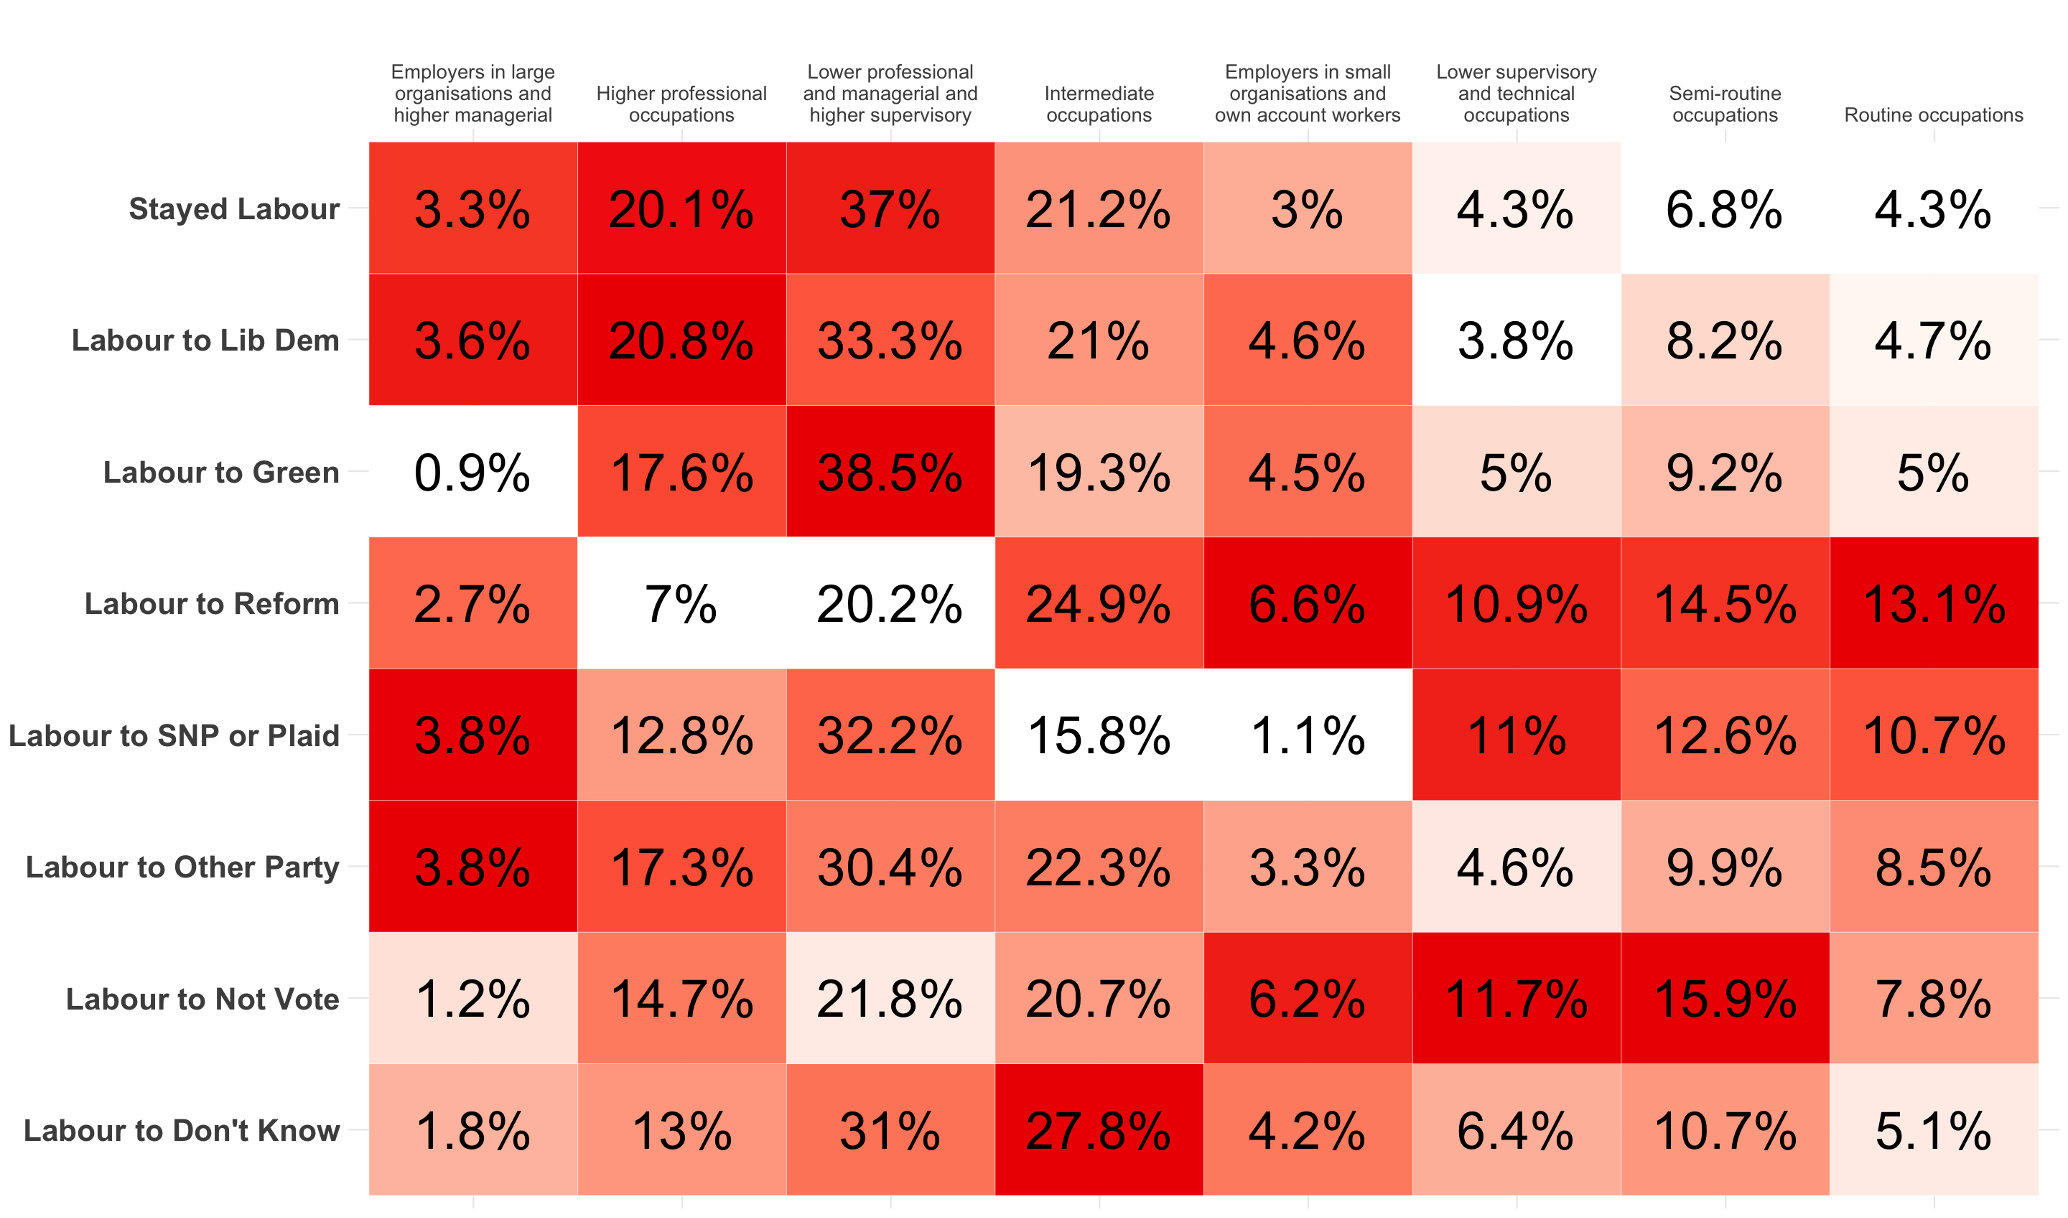
Social class paints another striking picture. Above uses the NS-SEC classification, which sorts people based on their occupation. It’s not perfect, but it lets us compare groups consistently.
Labour’s retained voters are pretty middle-class. 20% are in higher professional occupations, while only 7% are in semi-routine jobs and 4% in routine jobs. The Liberal Democrat switchers look very similar.
The Reform switchers, by contrast, are much more working-class. Only 7% are in higher professional occupations. 14% are in semi-routine jobs and 13% in routine jobs.
As an aside, I’ve always found it strange how psychologically painful it is for some to admit that the average Reform voter/switcher has a stronger claim to being working-class than the people still voting Labour or moving to “progressive” parties. I get that there’s a longing not to be the one voting for an “elite” party. And I get that class is more complicated than just a person’s occupation.
But, come on. There’s some real mental gymnastics required in order to claim that the average Labour voter is “more working-class” than the average Reform voter. The argument that, well actually, the precarity faced by a mid-level academic is in any way equivalent to the precarity faced by a cleaner or a binmen or whoever, is not one I’ve ever found convincing to put it mildly (particularly given the class background of the average academic, but that’s a story for another time).
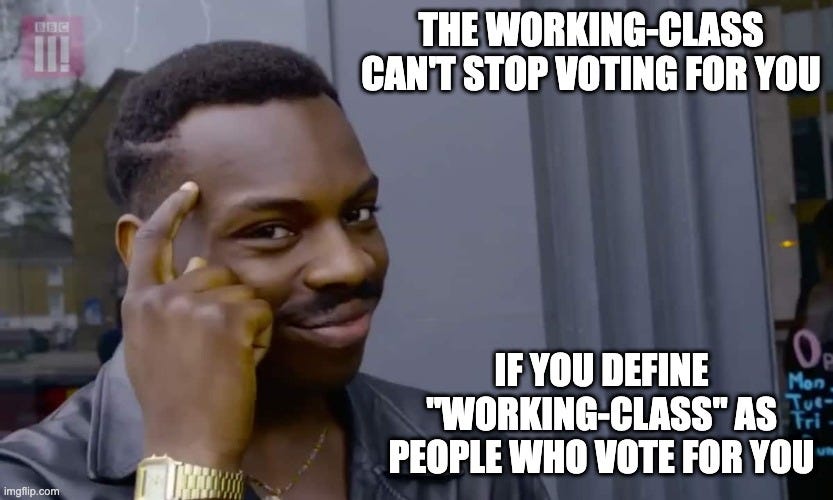
This is not a good way of thinking:
What Do They Believe?
The BESIP lets us map people’s views across different dimensions:
economic left–right
cultural liberal–conservative
political efficacy (how much they think politics matters and whether they can influence it)
populism (how much they see politics as a struggle between ‘the people’ and a corrupt or out-of-touch ‘elite’)1
All the results here are relative to the average BESIP respondent.2
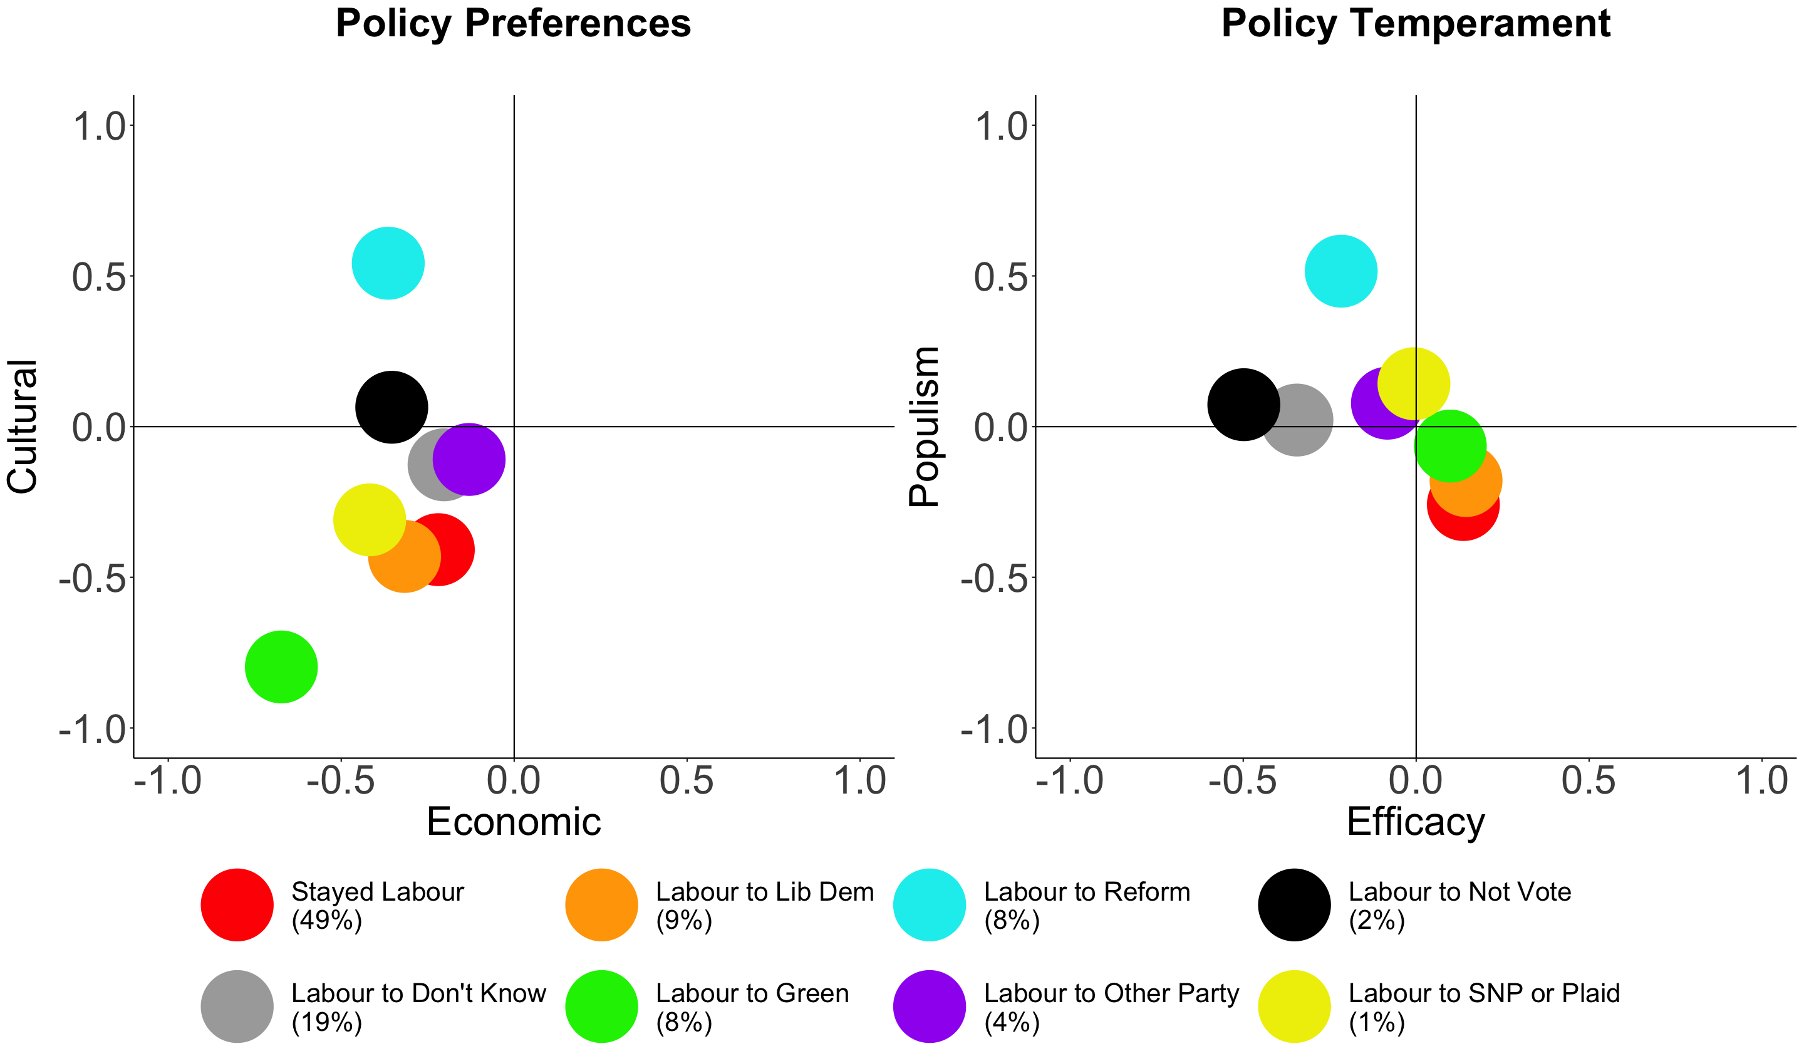
All groups are, on average, on the economic left. That is unsurprising, given they were all Labour voters in 2024. However, it’s worth pointing out, because it shows that they didn’t just choose Labour at random in that election. Their economic views make them at least somewhat open/sympathetic to Labour’s worldview, which helps explain why they backed the party in the first place.
The divisions come on cultural questions. Green switchers are much more socially liberal than the rest, but Reform switchers are much more socially conservative. The other groups cluster around cultural moderation or a slight liberalism but without going to extremes.
Reform switchers stand out as much more populist than the others, which helps explain why they have moved to populist party specifically. However, the other groups are close to the survey average on this scale.
When it comes to political efficacy, Reform switchers, don’t knows and non-voters stand out with low scores. That suggests a level of cynicism, which fits with either drifting to outsider parties or simply stepping back into uncertainty because they do not know how else to respond to their disappointment.
Most Important Issue
One of the best – and, indeed, most important – questions in the BESIP is the open-text “most important issue” question. Rather than ticking a box, respondents type in what matters most to them in their own words. This gives a better sense of what people genuinely care about and can help explain why they switched.

Across all groups, economic issues dominate. In every group but Reform switchers, “the economy” is the most named most important issue, usually far and above any other. It is named by 45% of don’t knows, 45% of Liberal Democrat switchers, and 30% of Green switchers. That matters because it suggests why there is discontent with Labour. Most of those drifting away are doing so while keeping their focus on core economic concerns.
Immigration, though, should not be ignored. It comes up for 14% of don’t knows, 18% of non-voters and 15% of other-party switchers. For Reform switchers it is the clear majority answer at 53%.
Similarly, the NHS continues to matter. “Health” is named as the most important issue by 10% of those moving to don’t know, 7% of Liberal Democrat switchers, and 10% of SNP/Plaid switchers.
However, the reality is that economic concerns were top of people’s minds in May.
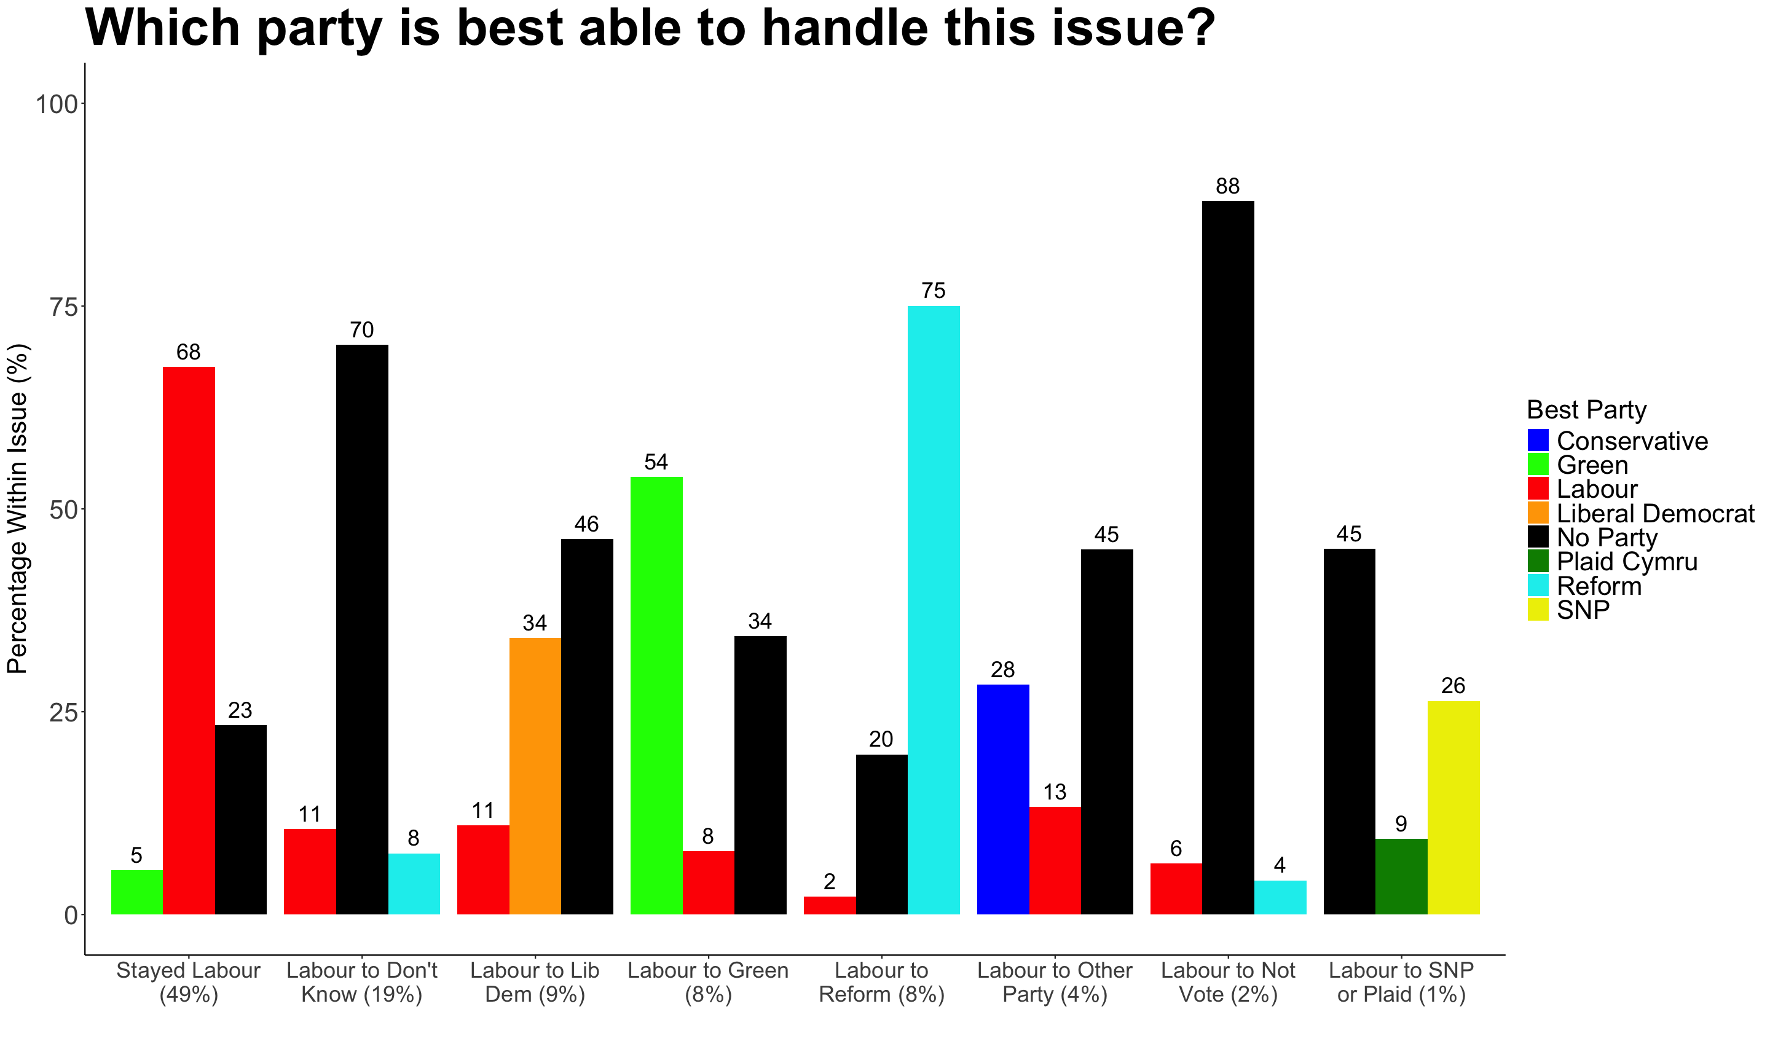
There was then a follow-up question asking which party the respondent thought was best placed to handle the issue that they named. Among those who left Labour, “no party” dominates, with this being named by 70% of don’t knows, 88% of non-voters and 45% of other party switchers. If you are being optimistic for Labour, there is a small glimmer of hope here. These voters are not naming another party instead, which means Labour could, in theory, claw some support back.
Among those who switched to the Liberal Democrats, nearly half (46%) of them say no party is best, which is higher than the 34% naming the Lib Dems. However, Labour is named by only 11%, so this is far from a reassuring result.
The picture is even worse among Green switchers, where a majority (54%) say the Greens are the best party for their issues, and among Reform switchers, where three quarters (75%) say Reform is the best. This suggests that these are largely settled in their new choices.
To show just how bad this result is for Labour, it is worth comparing the same people’s answers to the same question during the 2024 election.
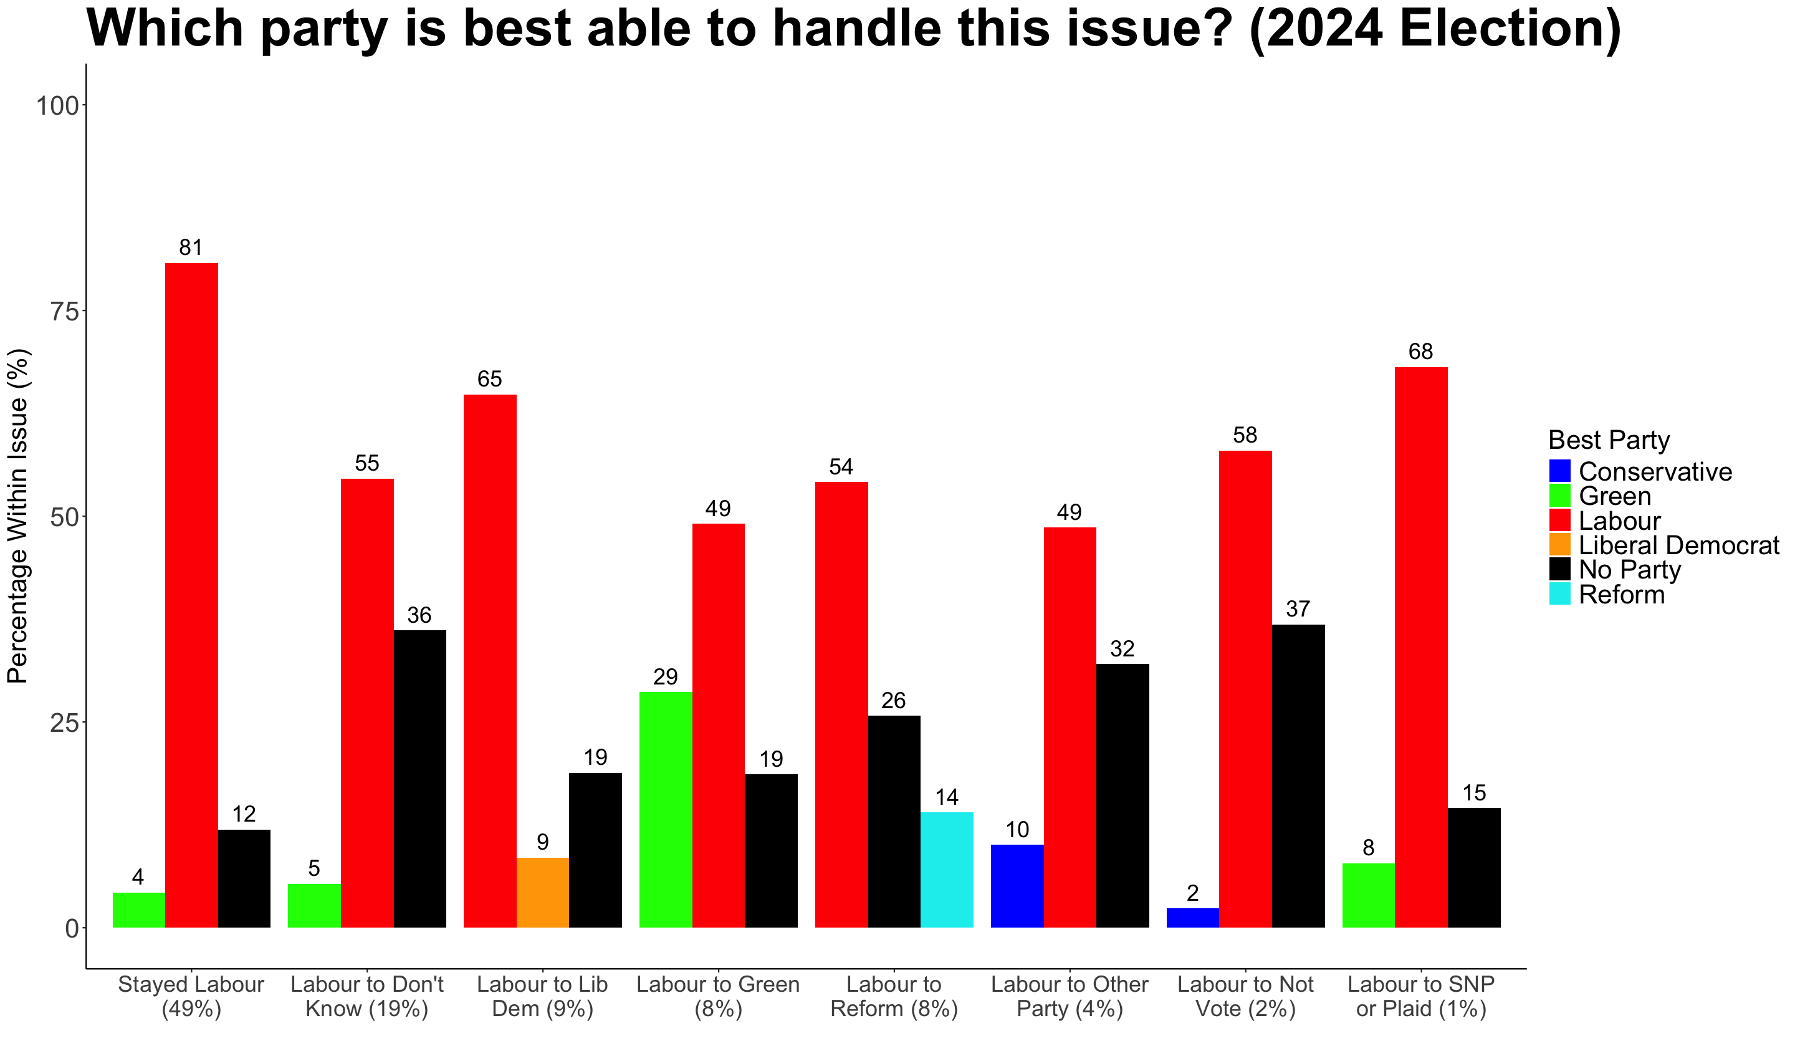
Back then, Labour was dominant. It was the most named party across all groups, even among people who have now changed parties. 49% of those now with the Greens said Labour was best on their issue during the election, and this was 54% percent for those now with Reform. The majority (55%) of those who are now saying don’t know were saying Labour was best on their issue back then. Labour had goodwill when it was elected, but it has since let people down. A lot can change in a year!
The Economy
The results on the “most important issue” question strongly suggest that economic matters are at the heart of people’s frustrations with the government, so how they are judging Labour’s record in office really matters.

Other than people who have stuck with Labour, the majority of every group say the government has handled the economy “very badly” or “fairly badly.”
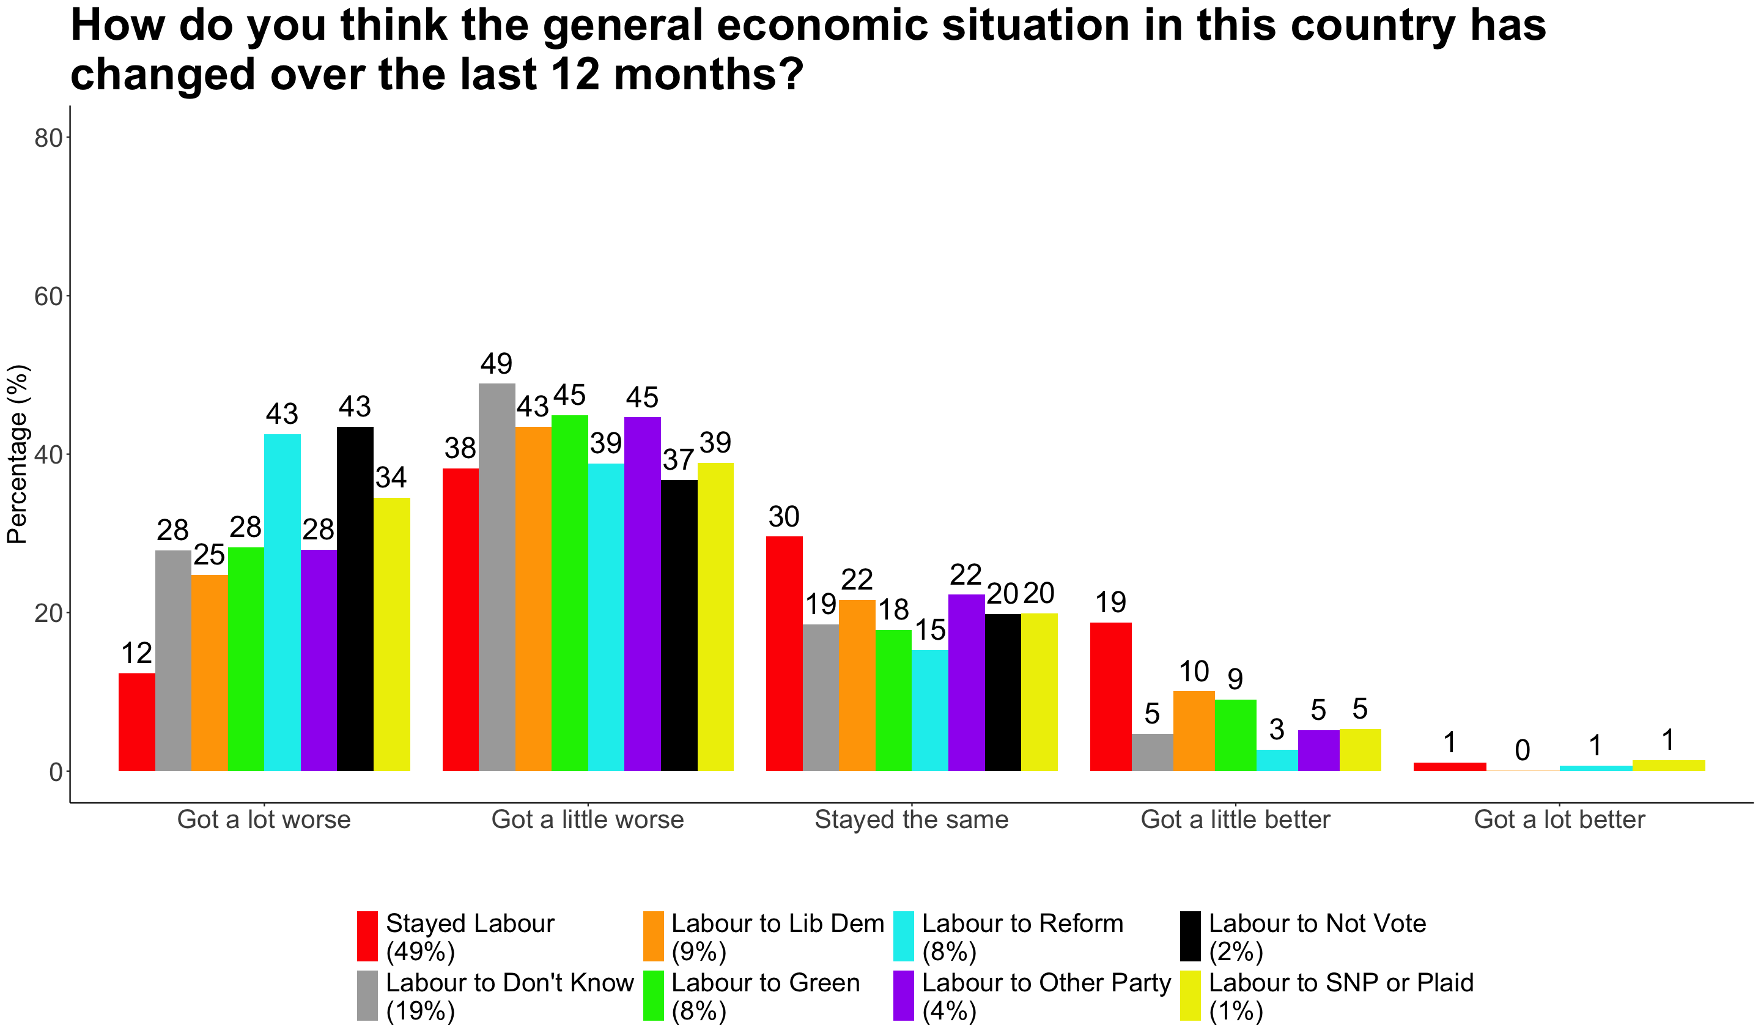
Once more, apart from those who stayed with Labour, most respondents in every group say the situation in the country has either “got a lot worse” or “got a little worse”.
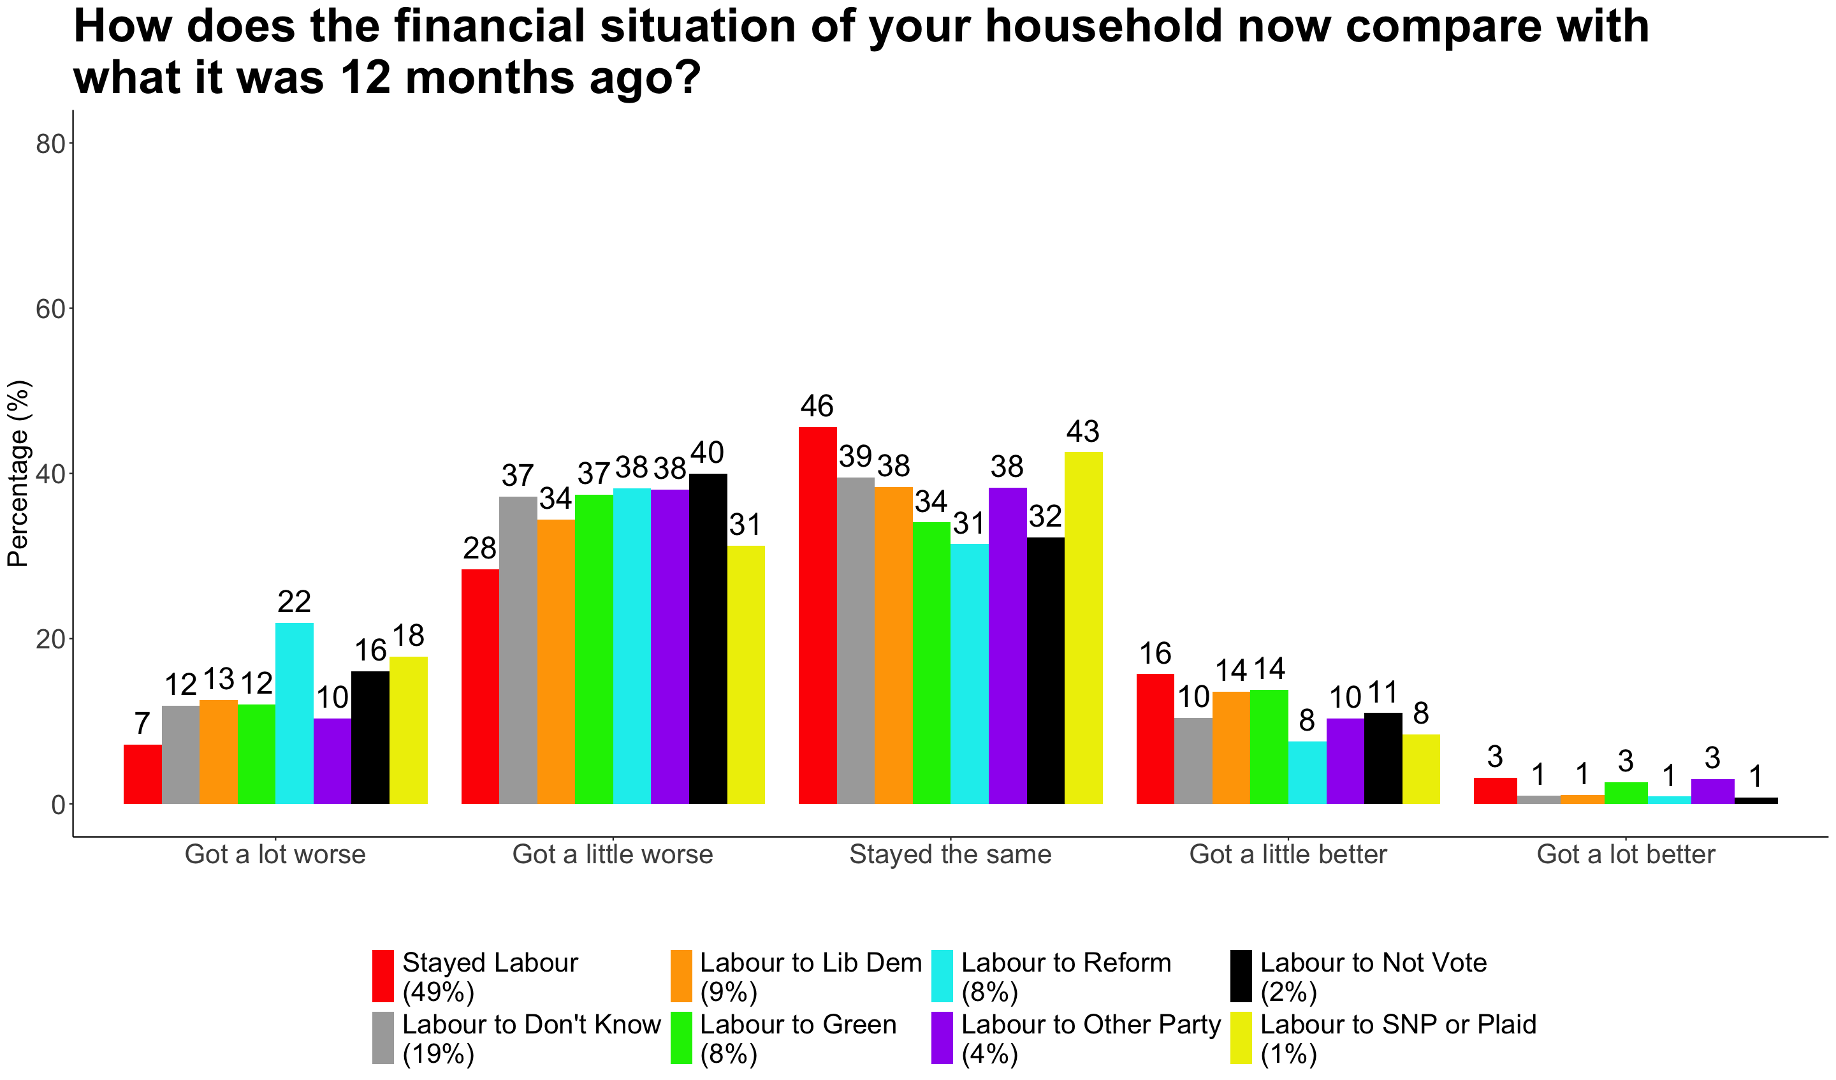
When people are asked about their own household finances, the results are a bit less harsh, but still worrying. Here, people saying the situation has “stayed the same” is a more popular answer than before. However, among those who did not stay with Labour, around half say their personal situation has “got a lot worse” or “got a little worse” in the past year.
Put together, this is a brutal set of results for a government that has made economic competence its main pitch.
If people think the economy is in bad shape, what do they want done about it? And how do they think Labour compares to that?
First, the BESIP asks people to place themselves on a scale between more spending even if it means higher taxes and lower taxes even if it means less spending, as well as asking people where they think Labour sits.

Every group places itself on the pro-tax and spend side, ranging from Green switchers at +2.2 to Reform switchers at +0.4. Crucially, don’t knows, Lib Dems, Greens, other party and SNP/Plaid switchers (as well as people sticking with Labour) all put themselves as being more supportive of taxing and spending than they see the current Labour government as being.
In other words, there is a gap between what people say they want and what they think Labour is doing. That could be a problem for the government, because even if people think the economy is in bad shape, it might not be fatal if they also believed the government was trying to fix it in a way that matched their own preferences.
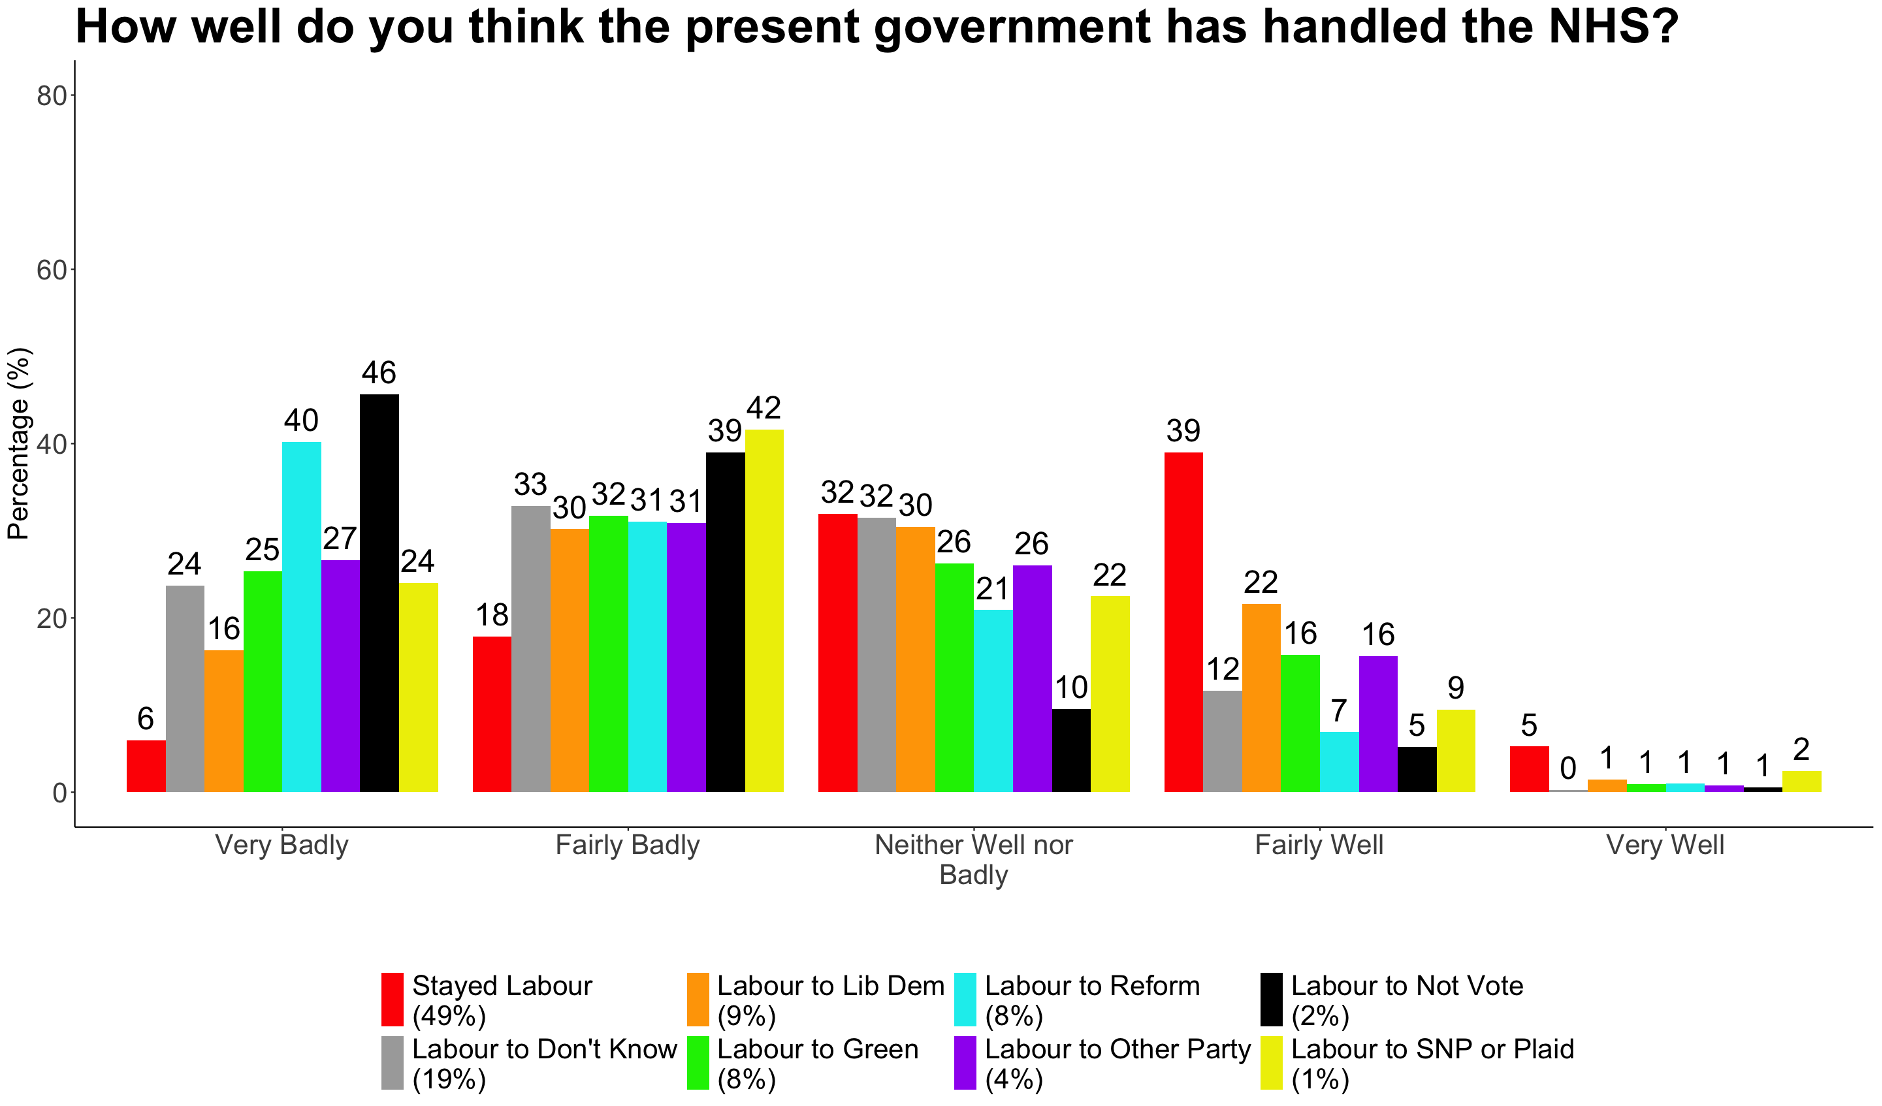
This feeds into attitudes on public services. When asked “how well do you think the present government has handled the NHS?”, the majority of all groups except Labour loyalists and Liberal Democrat switchers say “very badly” or “fairly badly”.
The NHS is one of Labour’s core issues and something the party has historically “owned” in the minds of voters. Issue ownership is crucial because it means people naturally trust a party on certain topics. For Labour to be failing on the NHS is very bad news because it signals they are losing credibility on an area where voters would normally give them the benefit of the doubt.
When a party cannot deliver on its signature issues, it becomes harder to recover lost voters or even to maintain support from people who should be sympathetic to you. It was the same situation the last Conservative government found itself in, as I argued in a pervious post. However, that took about 12 years to happen for them rather than 12 months for Labour!

Reducing economic inequality is another area that tends to matter for Labour voters. The BESIP asks people how concerned they think the government should be with making incomes more equal and where they think the government actually is.
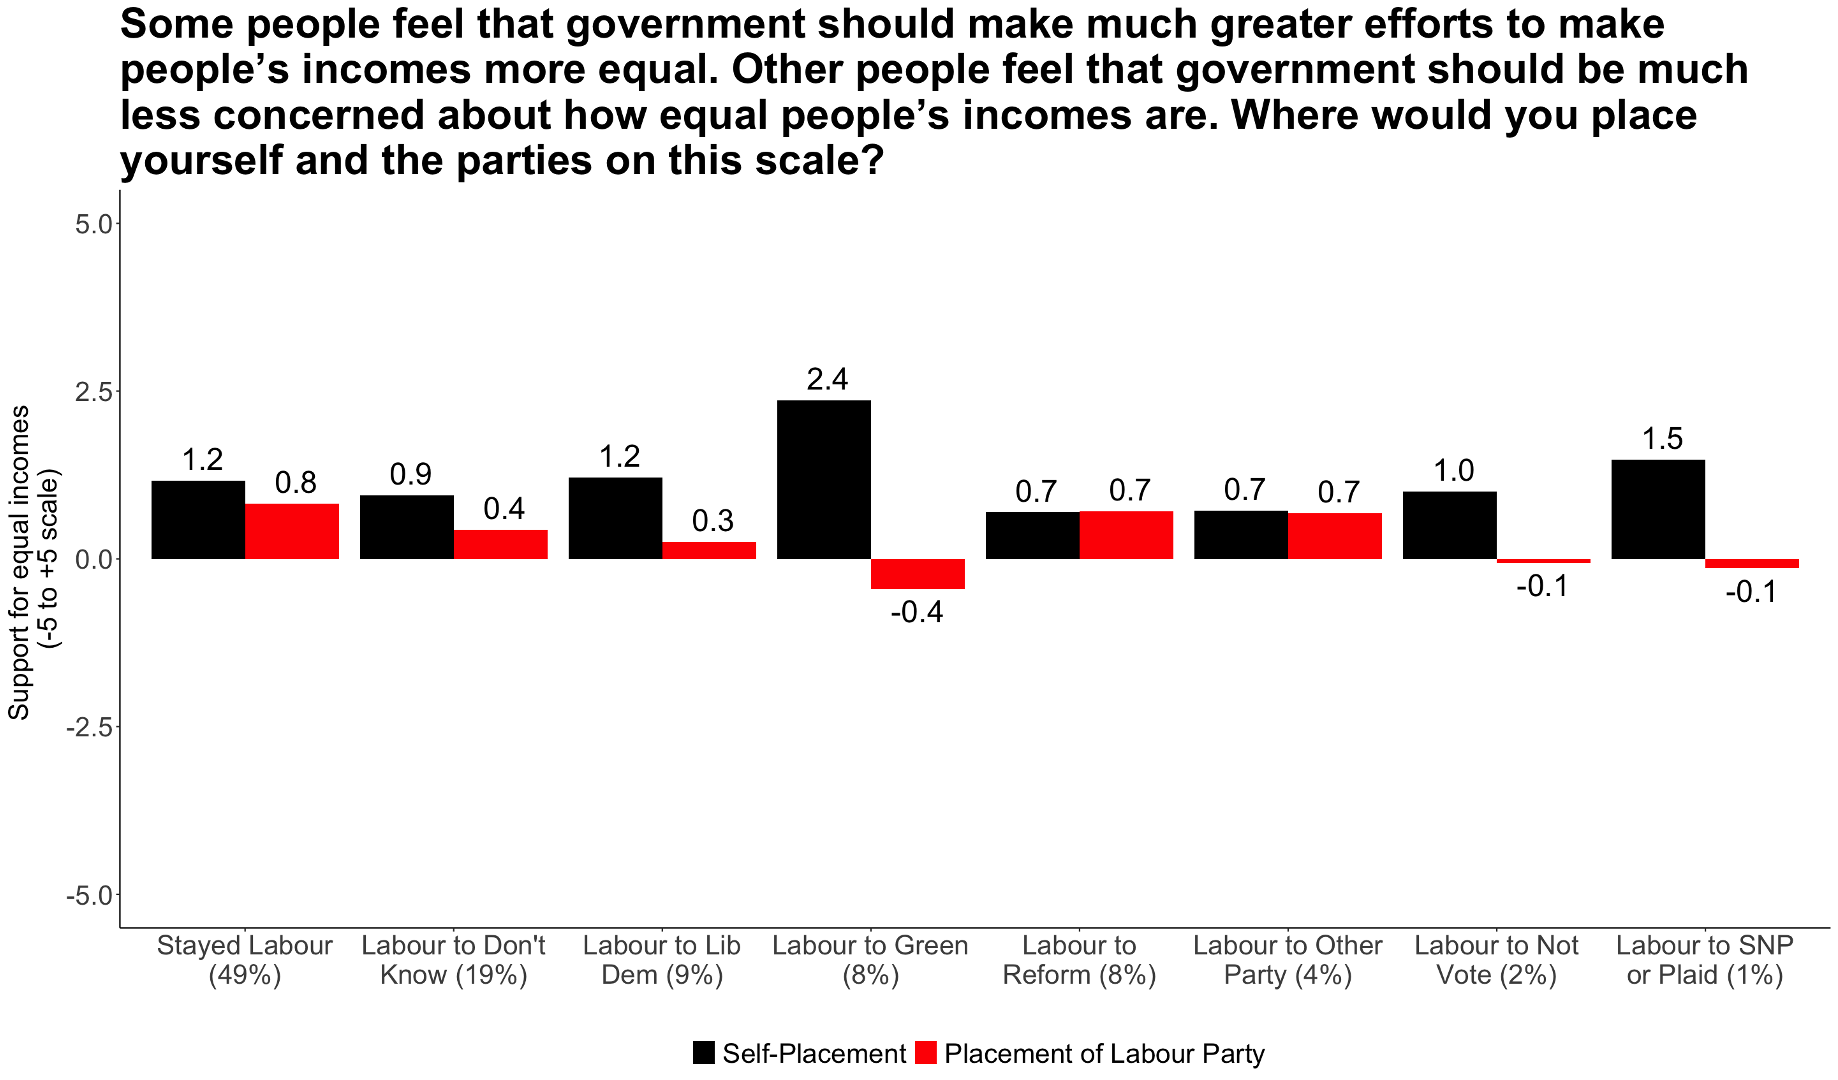
On this too, Labour is judged to be falling short. Groups consistently place themselves as more concerned about reducing inequality than they think Labour is. The gap is especially wide among Green switchers, who put themselves at +2.4 on the scale but Labour at -0.4.
Immigration and Brexit
The BESIP asks people where they place themselves on immigration (from reduce to increase) and where they place Labour.
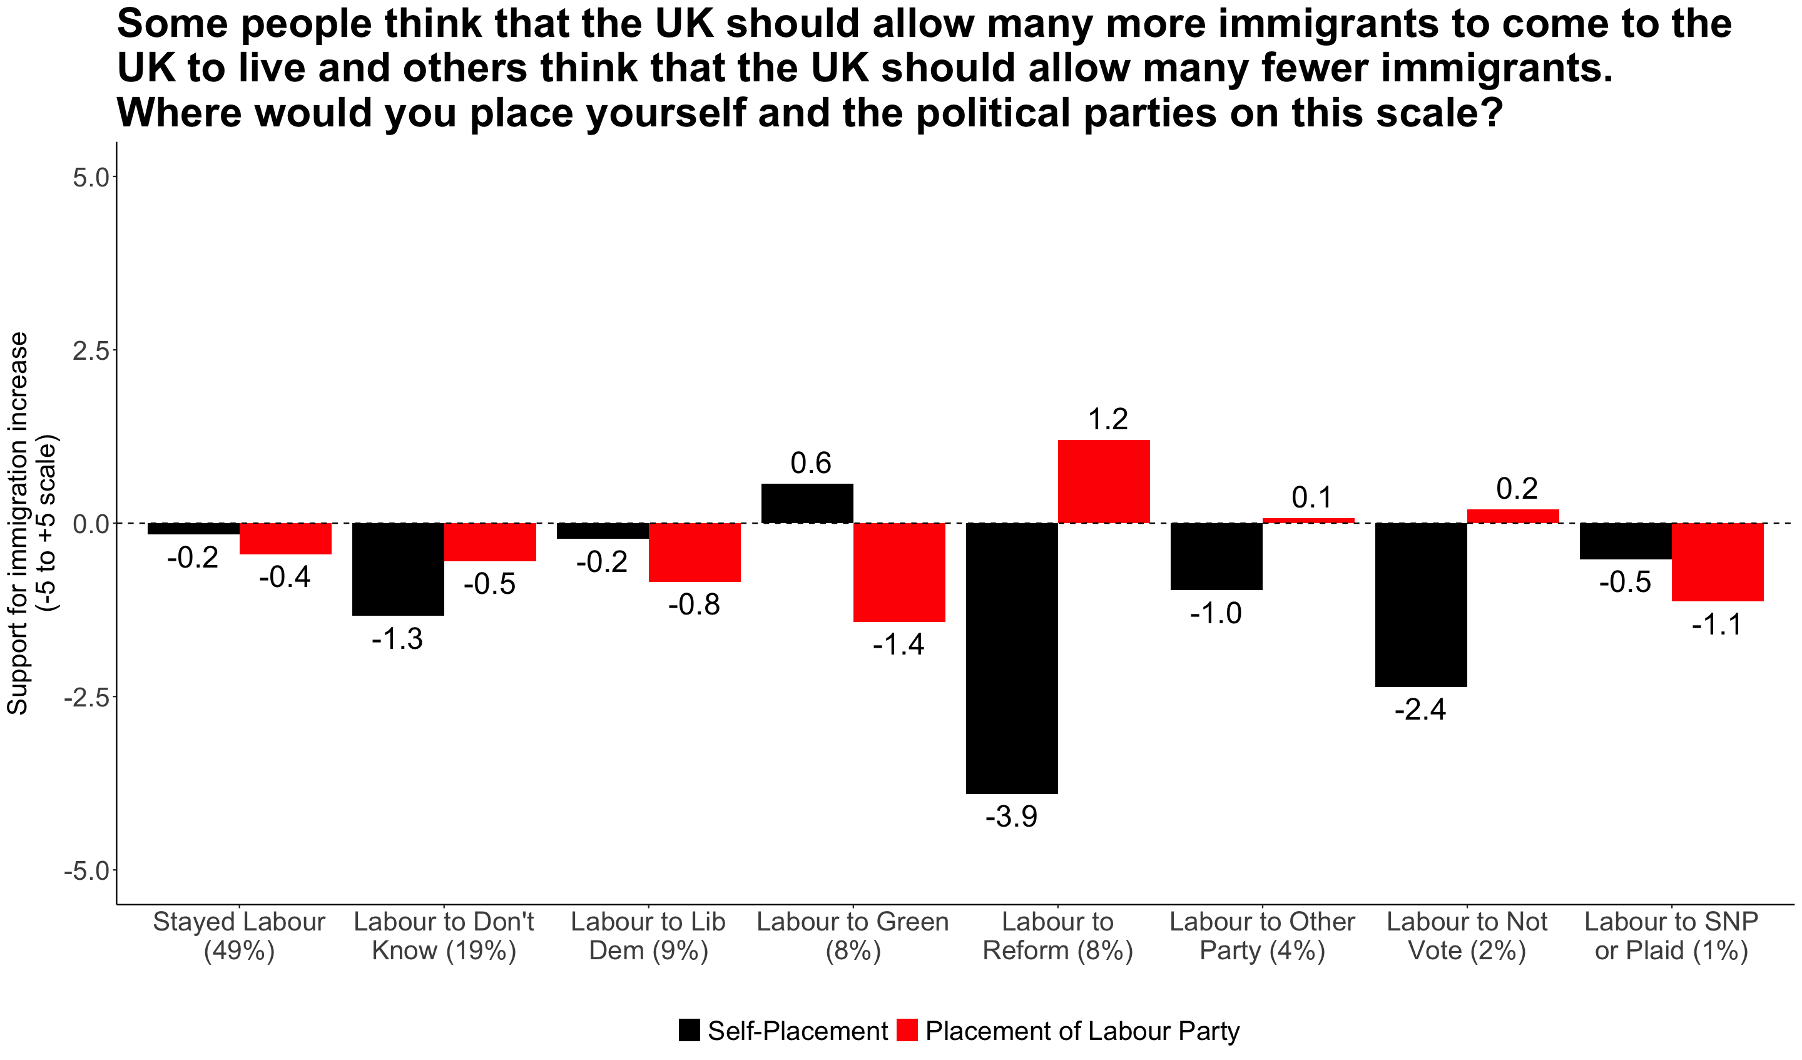
The results show why the party is in such trouble. The overall picture is that Labour is pleasing no one. It is seen as too hostile to immigration by the liberal-left, and too friendly to immigration by everyone else.
Green switchers see themselves as pro-immigration (+0.6) but view Labour as anti-immigration (-1.4). At the other end of the spectrum, Reform switchers see themselves as anti-immigration (-3.9) but place Labour as pro-immigration (+1.2).
A pattern similar to Reform switchers, though less extreme, shows up elsewhere. Those who went from Labour to “don’t know” place themselves at -1.3 but Labour at -0.5. Those who shifted to “other party” are at -1.0 versus Labour at +0.1.
At the other end, the Liberal Democrat group see themselves as less anti-immigration (-0.2) than Labour (-0.8).
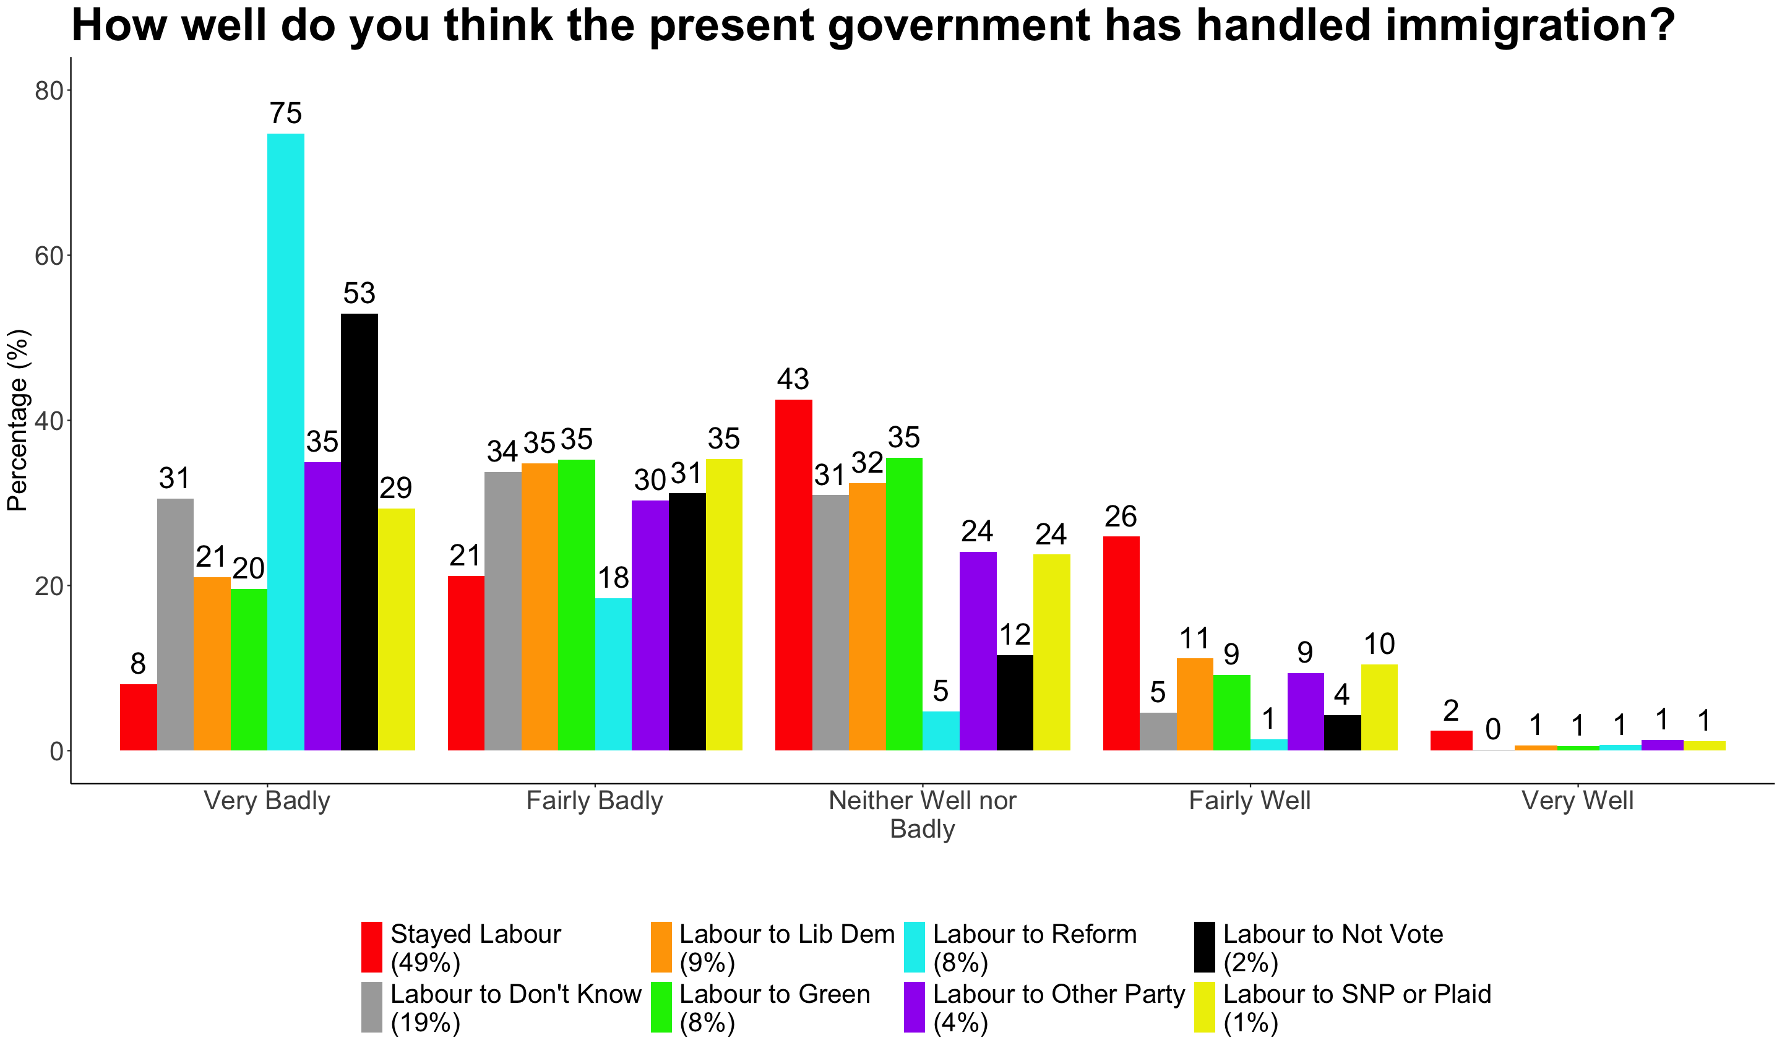
That helps explain why every group tends to say the government has handled immigration badly. The reasons differ, but the verdict is the same.
Brexit barely featured as a “most important issue,” but it’s still revealing to see how voters place themselves compared to Labour. With the exception of Reform switchers, every group views itself as more pro-EU than they think Labour is.
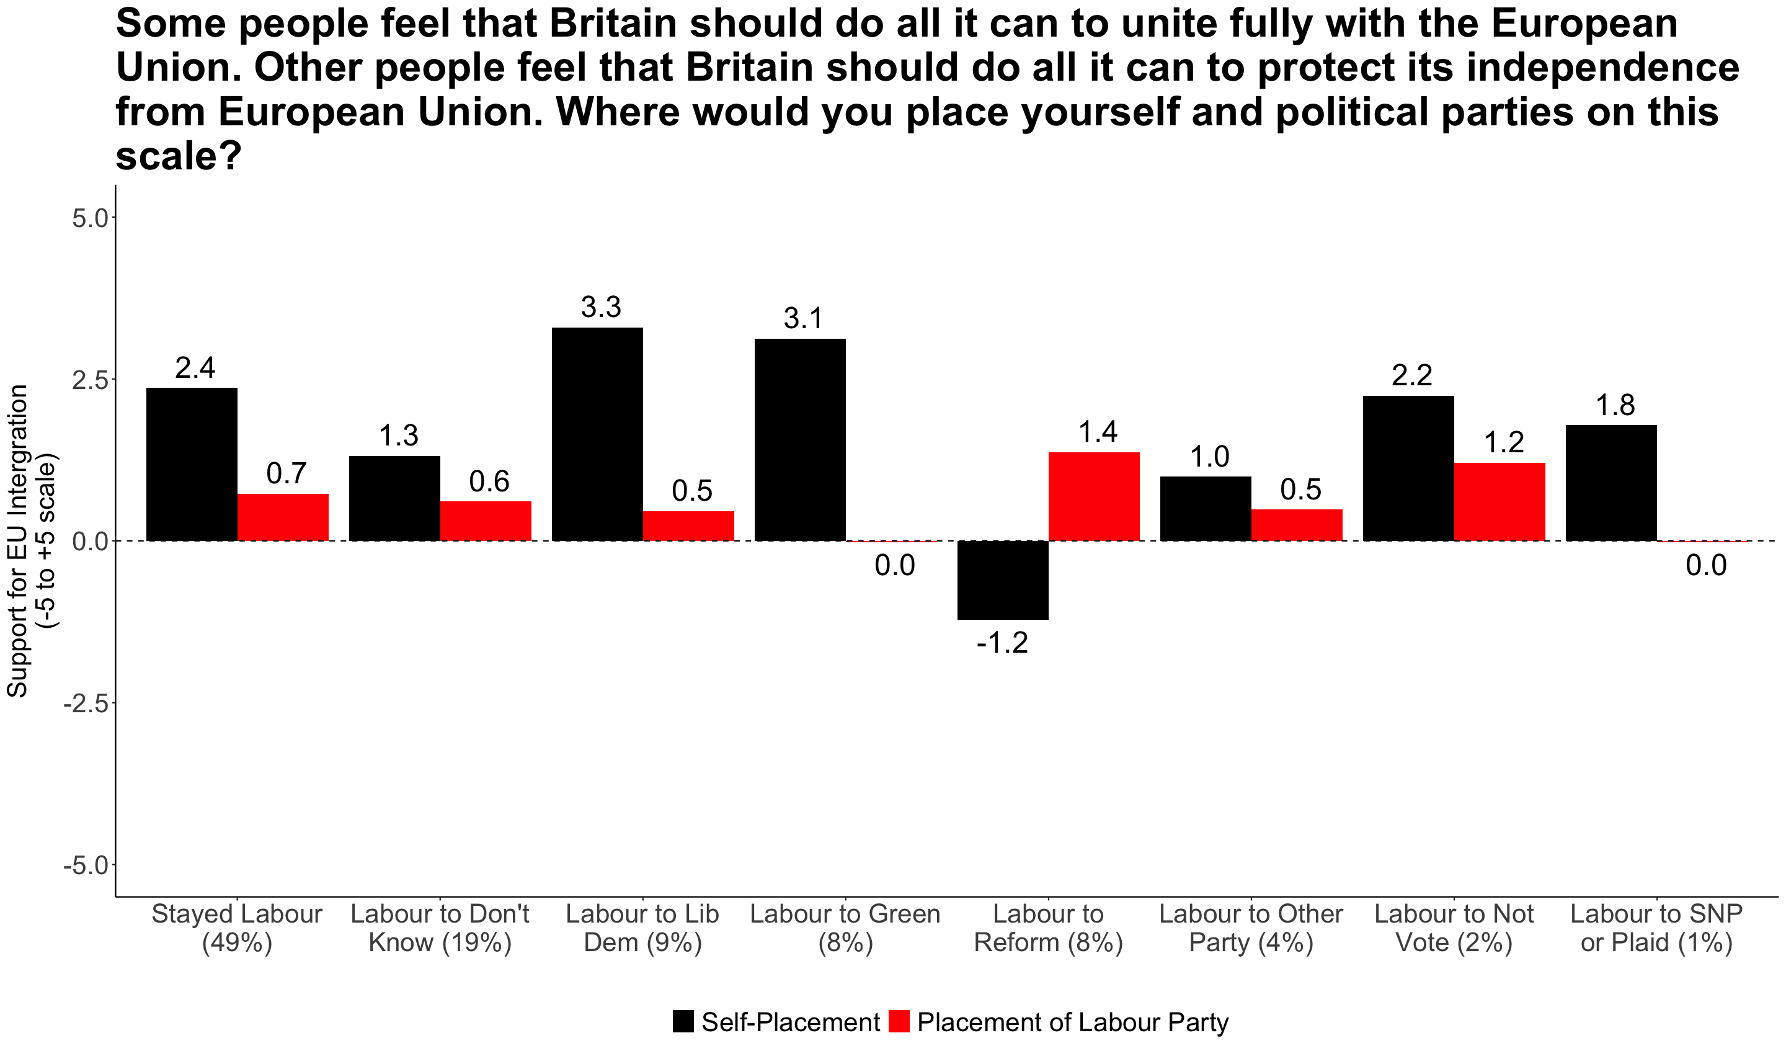
Those who stuck with Labour place themselves at +2.4 on the pro-EU scale, compared to Labour at +0.7. Don’t knows put themselves at +1.3, versus Labour at +0.6. Liberal Democrat switchers are the most Europhile, rating themselves at +3.3 while putting Labour at +0.5. Green switchers are close behind at +3.1, compared to Labour at -0.0.
The only group that breaks the pattern are Reform switchers. They see themselves as anti-EU at -1.2, while placing Labour much more pro-EU at +1.4.
Change?
Issues are not the only thing that matters in politics. More basic factors like leadership can matter just as much, if not more.
Every wave of BESIP asks people to rate political leaders on a 0–10 scale. This means we can track how people’s ratings of Starmer have shifted over time.
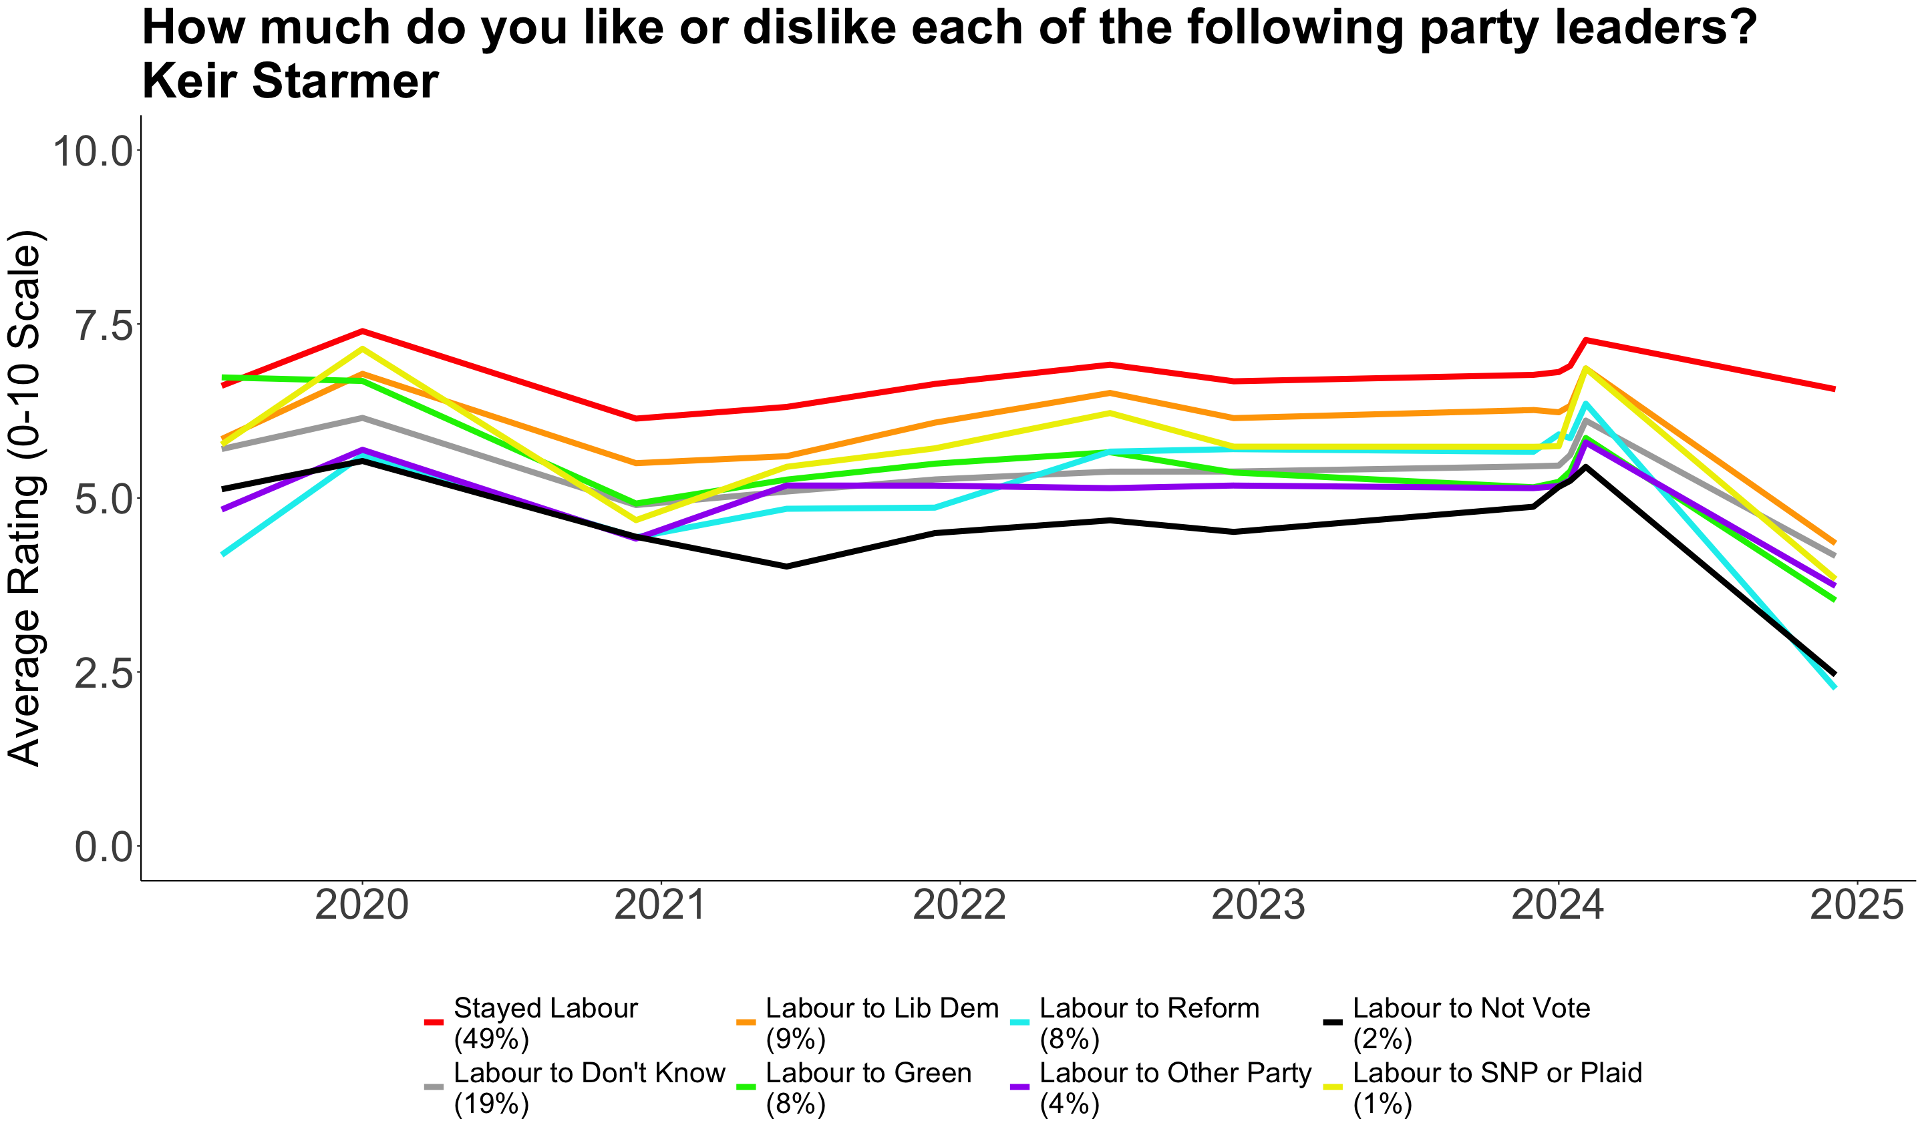
People who stuck with Labour have always been more positive about him than those who have since abandoned the party. That has been true since the start, suggesting Labour loyalists were always a distinct group.
What stands out is the sharp drop in ratings among everyone else between the 2024 election and 2025. Liberal Democrat switchers’s rating for him fell from 6.9 to 4.3. Green switchers went from 5.9 to 3.5. Don’t knows went from 6.1 to 4.2. And the most dramatic of all, Reform switchers went from 6.4 to 2.3.
We see the same pattern if we look at people’s willingness to vote Labour. Again, this is measured on a 0–10 scale, but now can be tracked all the way back to 2014.
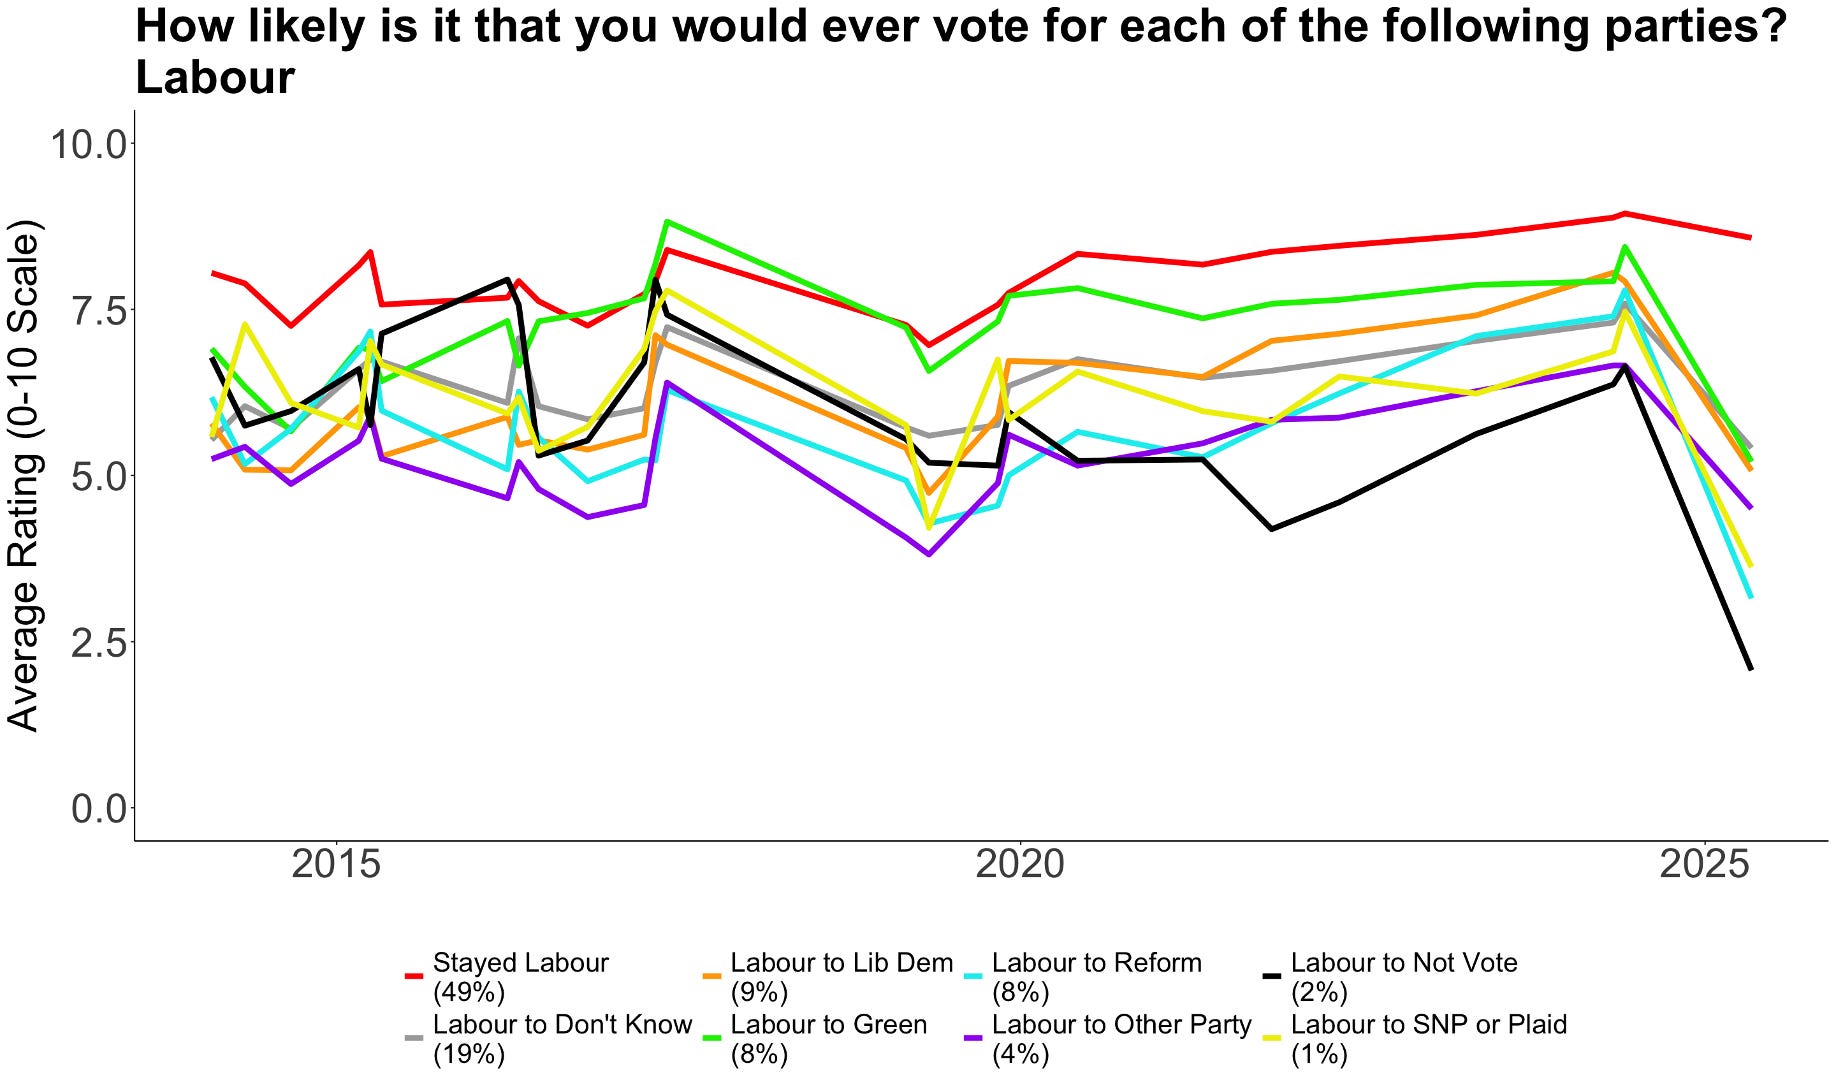
As before, those who stayed with Labour consistently rated their willingness to vote for the party higher than everyone else, which looks like loyal partisanship.
Green switchers are a bit different. Their willingness to vote Labour was very high during Corbyn’s leadership but lower before that and lower again under Starmer. That fits with previous work I’ve written on Corbyn voters’s distinct relationship with the Labour Party.

But once again the key story is the sharp fall from 2024 to now. Liberal Democrat switchers’s willingness to vote for the party went from 7.9 to 5.2. Green switchers went from 8.4 to 5.3. Don’t knows went from 7.8 to 5.5. Reform switchers fell the hardest, from 7.8 to 3.2.
Looking at 2025 only, we can see how each group is rating other parties, which gives us a sense of who they are considering.

Labour seems fairly safe with the voters it has held on to. Their willingness to vote Labour averages 8.5, comfortably ahead of the Liberal Democrats at 5.3 and the Greens at 4.4. Crucially, they rate Reform at just 0.5, so there’s little risk of them bleeding further votes in that direction.
The don’t knows could offer Labour hope. On average, they rate Labour highest at 5.5, but this is only just ahead of the Liberal Democrats at 4.5. That makes the Lib Dems a real competitor for these voters.
Among people who have already switched to another party, though, the story looks bleaker. Liberal Democrat switchers rate their new party at 7.7, well above Labour at 5.1. Green switchers put the Greens at 8.6, compared to Labour at 5.3. Reform switchers put Reform at 7.9 and Labour at 3.2. SNP/Plaid switchers rate their new party at 8.3 and Labour at 3.9.
If people have switched, they look fairly settled where they are. The only real room for Labour to recover support seems to be among the large group of don’t knows.
Those Are Some Pretty Charts, But What’s The Answer To Why Labour Have Lost Support?
The economy and public services, probably.
Weirdo academics and political hobbyists get excited by “culture wars” or other niche issues. These may make interesting headlines, because they’ve novel and different, but that doesn’t mean they are what normal people care about.
(Although they are what I have written about, so if you’re a weirdo like me 👇)


Looking at all the evidence in this article, Labour’s struggles on bread-and-butter issues are what really mattered. These are the things people overwhelmingly say they care about (which is pretty strong evidence to me) and they also view the government as failing.
The indicators all point in the same direction. Former Labour voters are showing clear disappointment with both the national economy and their own household finances. Crucially, they do not think things are improving.
Voters are focused on paying the bills, affording the shopping, and having access to decent public services. Normal voters have normal demands. Labour’s failure to meet those basic expectations is at the heart of why so many have drifted away.
You can partly defend Labour by pointing out it has only been a year in office. That is fair and you cannot magically fix everything overnight.
But it’s only a fair point if the government is actively making substantial changes to try and turn things around. I’m going to suggest that this does not appear to be what has happened or what is planned. Another year of Treasury-Brain short-termism is not inspiring confidence and with good reason. Negative ratings are exactly what you would expect in that case.
I'd Like to Change My Point of View If I Could Just Forget About You
Recently, a new academic paper got a lot of attention on Bluesky. The researchers looked at how people reacted to Keir Starmer’s so-called “Island of Strangers” speech. They used a setup that allowed them to treat exposure to the speech as almost random, so they could see how it affected individual voters’s perceptions.
People who saw the speech started to view Labour as more anti-immigration and right-leaning. However, their support for Labour dropped and also didn’t lead to lower support for Reform. The authors use this to make the broader point that when social democratic parties adopt anti-immigration rhetoric to try and win votes, it tends to hurt them electorally.
It is a strong and interesting paper with a clear use of causal inference, and it’s worth reading if you can access it.
That said, a couple of caveats. First, everyone on Bluesky getting excited about something should automatically give you pause for thought. At the time of writing, the original post has over 1,000 reposts and 2,000 likes. Call me cynical, but it’s unlikely that everyone engaging with it actually read the paper. People get enthusiastic about research that confirms what they already believe and that argues Labour should peruse a strategy they agree with, but that doesn’t mean it’s right. This is not a criticism of the academics who wrote the paper, it’s a criticism of people blindly and uncritically sharing it.
Second, and more importantly, the effects of Starmer’s speech are relative. Yes, saying anti-immigration things hurt Labour among voters who might otherwise be sympathetic (at least for the 20 days that the study took place over). And yes, one speech without substantial follow-up action (and a substantial reduction in boat crossings) was not enough to win back Reform switchers who care about immigration.
But think about what the impact could have been if this kind of experiment had focused on something we know 2024 Labour voters care deeply about, such as economic or public service issues. For example, imagine the effect sizes if this had been run when the government announced changes to the winter fuel payments. That policy has consistently been one of the things voters dislike and care about the most, even as time passes.
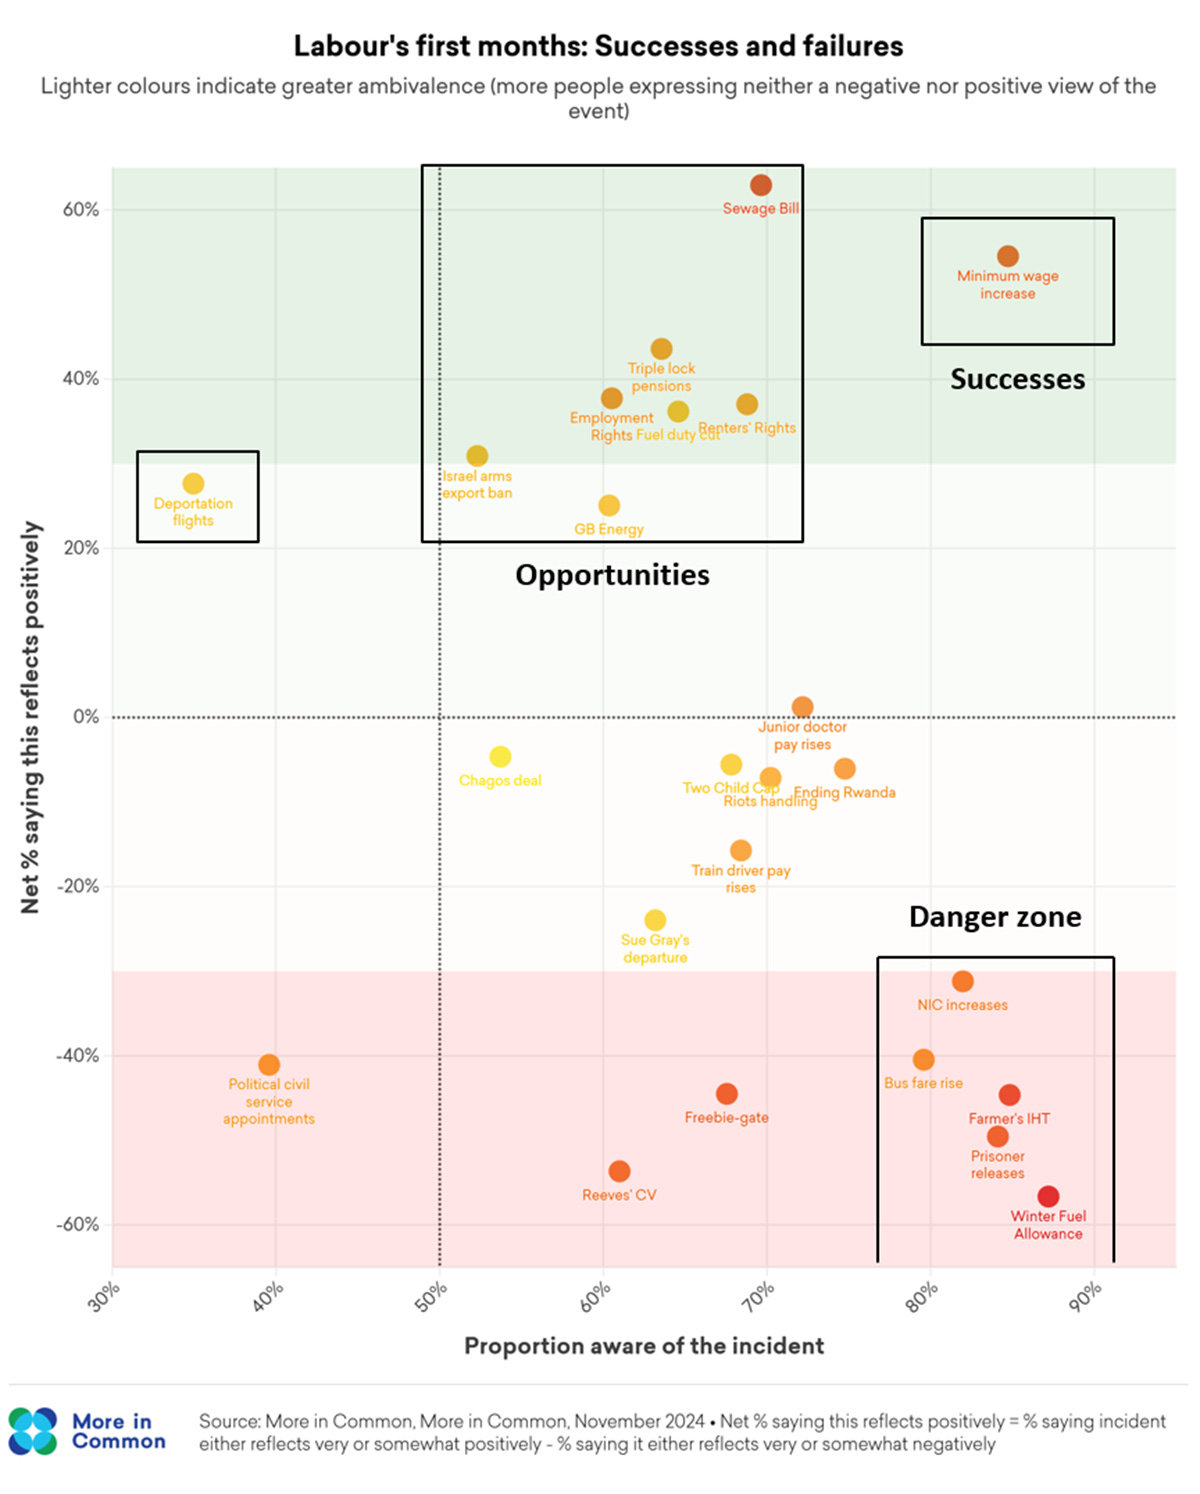
2024 Labour voters in the BESIP actively want more spending, even if it means higher taxes, and view the government as not as committed as they are to this. Labour’s failure to deliver on the issues that matter most to these voters is what is driving disappointment and defection. Starmer’s anti-immigration speech had an effect, but real, sustained discontent comes from failing to meet these core expectations.
The Two Sweetest Words in the English Language
The winner of the next election could easily walk away with a large majority by default on just over 30% of the vote.
That’s where the opinion polls are, at the time of writing. Reform are between 30–35%, giving them roughly a 10-point lead, with Labour, the Conservatives, Lib Dems and Greens all above 10%. Add to that high levels of support for the SNP in Scotland and Plaid in Wales, and you have a fractured political landscape.
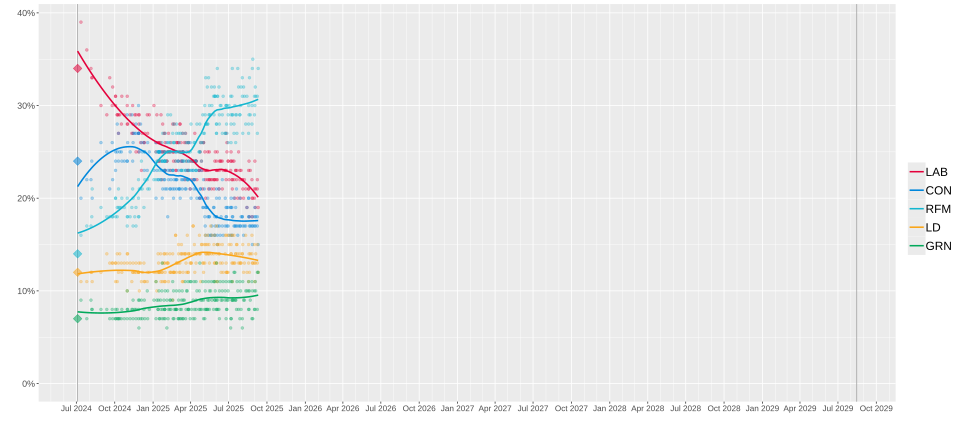
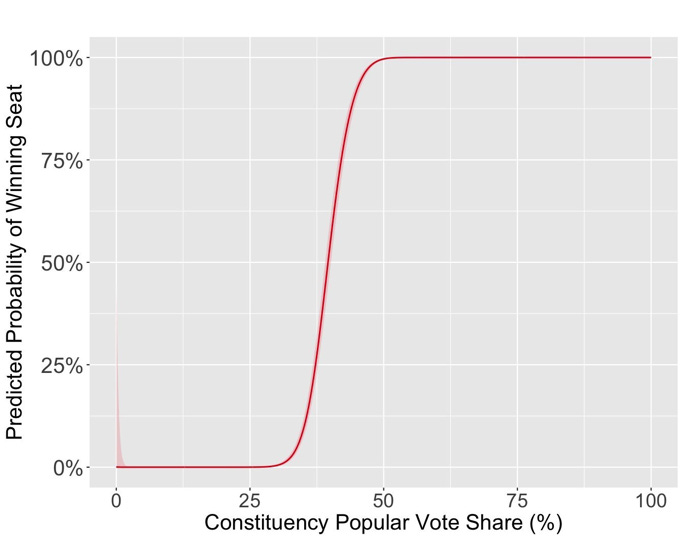
Here’s where FPTP goes a bit wacky. If you look at constituency results in England, Wales and Scotland from 1945–2019, you can calculate the probability of winning a seat based on your share of the vote.
In plain terms, if a candidate got around 40% of the vote, they had a 50/50 chance of winning that constituency. If they got below 40%, their odds dropped off sharply. However, if they got above 40%, their chances improved dramatically.3
But today’s fragmentation blows this model apart. When votes are split five or six ways, the bar for winning isn’t 40% anymore.
Nigel Marriott’s analysis of the May 2025 local elections looked at 533 single-member wards where only the Conservatives, Labour, Lib Dems, Greens and Reform stood candidates. He found the new tipping point (the average vote share you need to be the favourite to win) has dropped to 33%.
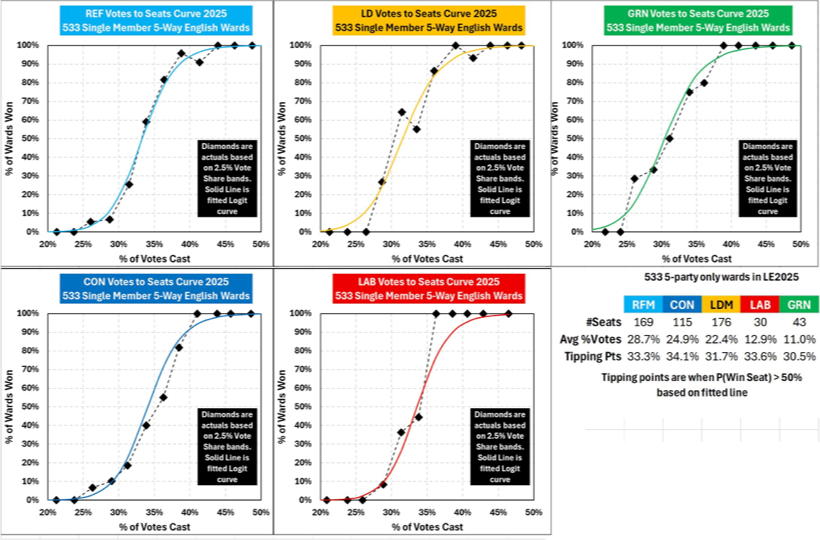
In other words, you don’t need to command anything like majority support in a seat anymore. A party with getting in the low 30s could turn that into a landslide.
Historically, as Callum Hunter argued, Britain’s electoral system acted as a “filter” against outsider and third parties. To win seats, they needed geographically concentrated support. This is why UKIP gained almost no representation in 2015, because they were getting roughly similar levels of (low) support evenly across the country, rather than a high level of support in just a few constituencies.
But once a party breaks through that barrier, the very same system that once blocked them can start protecting and entrenching them in power, offering them the same advantages that Labour and the Conservatives enjoyed for decades.

So does all this mean Labour are already screwed? Not exactly. There are still lots of undecided voters, and the next election is a long way off.
But it’s a bad place to be starting from. Labour’s 2024 win came on the back of an extremely efficient FPTP vote distribution, where they pulled off a huge landslide on a lower national vote share than Jeremy Corbyn managed in 2019.

Many constituencies were won on narrow margins. That means even a small swing could wipe them out. Retaining only 49% of their 2024 voters is bad in any circumstances, but given how fragile their base was to begin with, it’s especially dangerous.
Labour’s problem isn’t just that they are losing voters (although, obviously that’s important), it’s that they are losing them in a system where the margins are tiny and the risks are magnified. If they can’t turn around perceptions on the economy and public services, then the mechanics of FPTP mean that what looks like a narrow slip in vote share will spiral into a collapse in seats.
The populism scale was not included in this wave of the BESIP, so I took people’s most answers to these questions from the most recent time they answered
Scores are created using graded response model separately on each survey scale.
In non-plain terms, this looks like a sigmoid function.
"There’s some real mental gymnastics required in order to claim that the average Labour voter is “more working-class” than the average Reform voter."
I think this depends strongly on whether you focus on the "socio" or the "economic" part of "socioeconomic". While I take your point about precarious academics vs precarious cleaners, the steel-man version of this argument would be that being working class ought to involve... you know, working. NS-SEC treats retired people according their pre-retirement profession, but given retired people are (i) a fifth of the UK population and (ii) strongly overrepresented among Reform supporters, this gives a misleading impression of Reform support.
If we grant a classical conception of class as being primarily an economic category, then it seems very plausible that Labour support is "more working class" than Reform, whose supporters are less likely to be involved in the labour market and more likely to own their house outright than those of any other major party.